Advanced Technical Analysis Using Fractals - Crypto Academy S5/W8 - Homework Post for Professor @reddileep


Hello Steemians, I welcome you all to the last week of season 5 in the Steemit Crypto Academy. In today's lesson, professor @reddileep introduced us to another great technical analysis tool which is Fractals. The idea behind fractals is that the market move in repetitive patterns and due to the psychology of traders, these patterns are like to occur in the future for traders to take advantage of it. A good example is a psychology of selling at resistance and buying at support.
Every trader has this mindset that price always reverses at these levels and thus there's high selling and buying pressures when price get to these levels. This forms the basis of fractals as previous chart patterns are relied on to make trading decisions.
Let's get down to understandFractals better in this post.
Understanding Fractals
The crypto market changes daily and price fluctuations vary due to forces of demand and supply. Despite these market changes, price tend to repeat similar patterns on the chart on which traders lay their trading psychology. A good example of regular chart patterns is the double top, double bottoms, engulfing patterns, Haramis, flag patterns, inverted hammer, etc.
These patterns are seen on the chart regularly and traders based their trading decision on these patterns as they reveal key market information. Fractals are considered as repetitive patterns on the chart. These patterns can be bullish or bearish depending on the current market situation. The psychology of traders strongly depends on fractals as they expect the same market reaction when these patterns unfold on the chart.
Most indicators have been designed based on fractals to help spot these patterns easily on the chart. Williams Fractal indicator is one of the popular indicators that help to identify fractals easily on the chart.
Let's look at the major rules for identifying fractals.
Major Rules for Identifying Fractals
Rules are always meant to be respected especially when there's risk involved. Every trading strategy and pattern has rules that govern it for successful trading decisions. Violation of these rules can lead to making wrong investment decisions and falling for fakeouts.
In this section, we will be looking at the major rules to identify fractals in the market.
- For a pattern to be considered a fractal, it must comprise of at least five bars/candle or more. The number of candles involved determines the accuracy of the fractal. The higher the number of candles, the higher the accuracy and vice versa.
- Fractals identified on the chart must correspond to the market trend. Bullish fractals are expected to follow a bullish trend and Bearish fractal is expected to follow a bearish trend. A fractal can signal a trend reversal or trend continuation depending on the pattern and also where it is formed.
- For a Bullish fractal, the middle candle must comprise of a lower low with two higher high candles on each side of the middle candle. An example can be seen on the chart below.
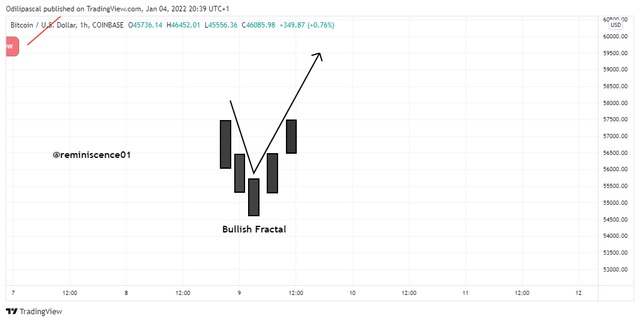
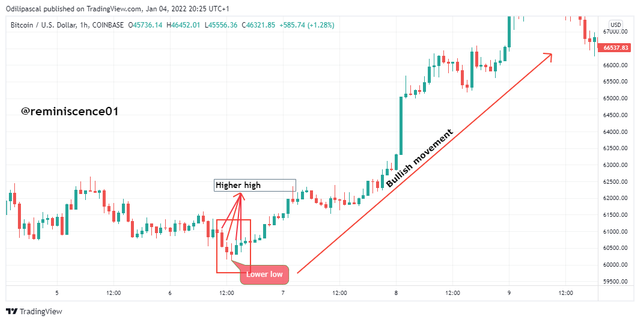
From the above, we can see a good example of a bullish fractal on the chart. We can also see how this setup follows the rules of bullish fractal as explained. The bullish fractal signals a trend reversal in this situation and we can see how it is accompanied by a bullish movement.
- For a Bearish fractal, the middle candle must comprise of a higher high with two lower low candles on each side of the middle candle. An example can be seen on the chart below.
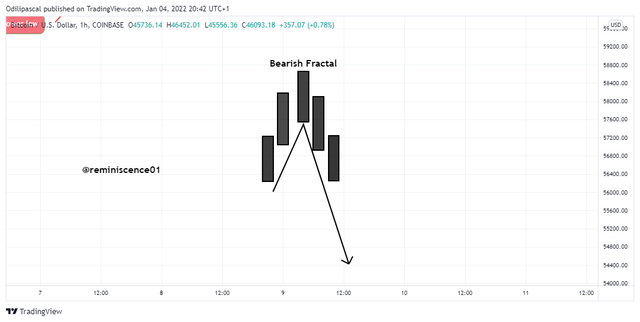
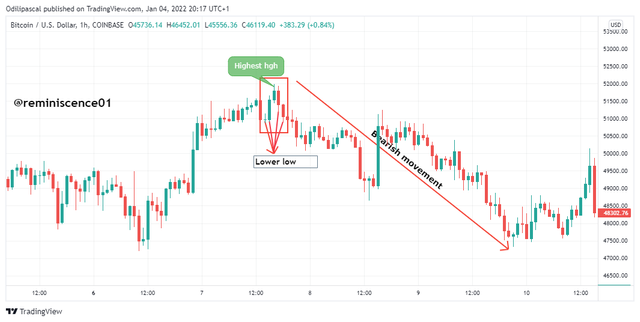
From the above, we can see a good example of a bearish fractal on the chart. We can also see how this setup follows the rules of bearish fractal as explained. The bearish fractal signals a trend reversal in this situation and we can see how it is accompanied by a bearish movement.
Different Indicators that can be used to identify Fractals
We have discussed the concept of fractals in the previous sections. It is not easy to identify these patterns and make trading decisions based on them. We already know that fractals are based on past price data which will be difficult for a trader to determine using basic calculations. Technical indicators have been developed using mathematical models of past price data points to help identify fractals on the chart.
The most commonly used fractals indicator as explained in the lesson is the Williams Fractal Indicator. Aside from that, there are other fractal indicators like the Fractal Support and Resistance, Fractal Breakout, etc.
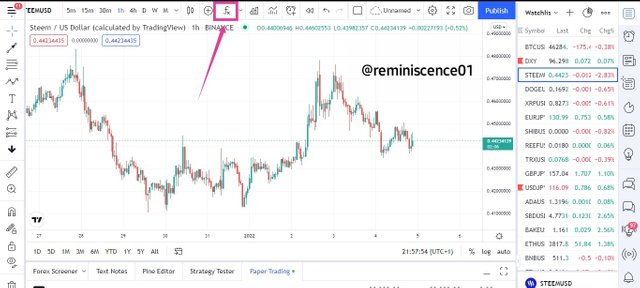
Before we go into these indicators, let's look at how we can add fractals to the chart. I will be adding the Williams Fractal indicator on Tradingview.com. The steps are as follow:
- On the Chart interface, click the indicator icon fx at the top page. This opens up the indicator interface.
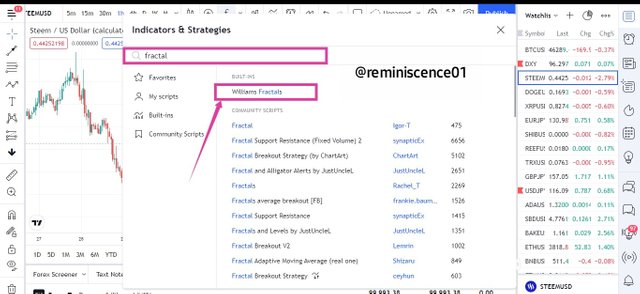
- On the landing page of the indicators, you can easily locate your desired indicator by using the search bar. Here, I will type fractal and click on Williams Fractals for the indicator to be added to the chart. We can notice there are several fractal indicators available on the Tradingview platform.
This can further be illustrated using the screenshots below.
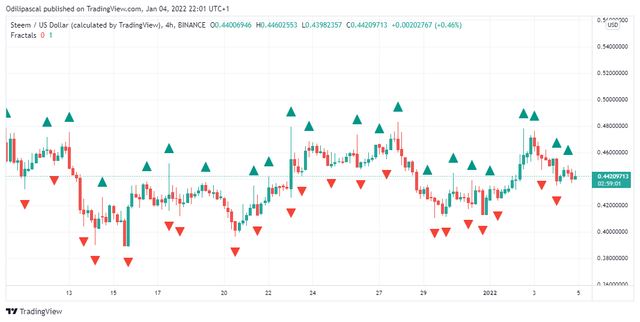
Understanding Williams Fractal Indicator
William Fractal indicator is one the most commonly used fractal indicator in the market due to its simplicity in identifying buy and sell signals. Looking at the chart above, we can see green and red arrows pointing upward and downward. These arrows are pointing at fractals identified on the chart. The green arrows pointing up are considered as bearish fractal which signals the best time to sell an asset, while the red arrows pointing down are considered as bullish fractals which signal the best time to buy an asset.
The signals information of the Williams Fractal Indicator can be used by traders to make a good trading decision. Also, the effectiveness of the Williams Fractal Indicator can be increased when this indicator is combined with another indicator like the Alligator.
Fractal Support and Resistance
There is so much information that can be drafted from fractals in the market. One of them is support and resistance areas. Support and resistance are areas of high buying and selling pressures that traders look out for price reversal or continuation. The fractal support and resistance indicator helps to automatically spot support and resistance by connecting horizontal higher highs and higher lows of past price data. Traders can utilize the Fractal support and resistance for price reversal signals or price breakouts in the market. The chart below shows Fractal Support and Resistance on the chart.
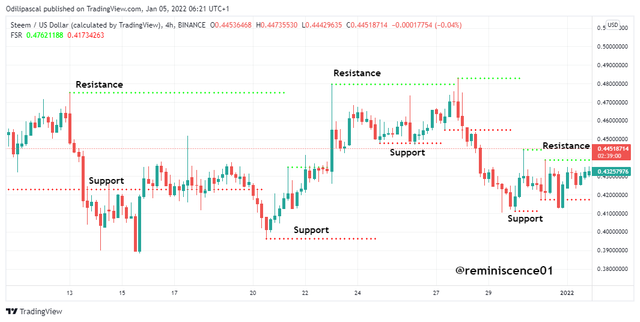
From the chart above, we can see how the Fractal support and resistance helps to identify key support and resistance areas on the chart. We can also see price reactions on this level and make good use of the indicator for our trading decision. From the chart, we can see how price reverses when it gets to the support and resistance areas drawn on the chart. Also, potential price breakout can be identified using the indicator.
Fractal Breakout Strategy Indicator
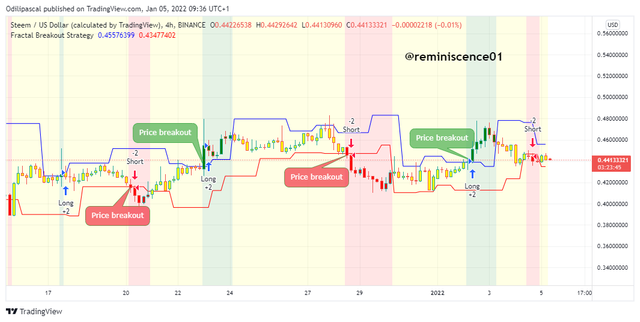
Another fractal indicator is the Fractal Breakout Strategy indicator that helps to spot price breakouts in the market. The indicator comes with an upper and a lower band which is drawn on the chart using a blue color and a red color. This is the default color that can be modified to suit a trader's style.
The upper and lower boundaries on the indicator signify fractal points which are joined together automatically using a trendline. These lines serve as support and resistance areas on the chart. The Fractal Breakout Strategy signals long and short positions are price breakout below and above the upper band and the lower band.
A break below the lower band is identified as a bearish breakout which is indicated by short on the indicator. Also, a break above the upper band is identified as a bullish breakout which is indicated by long on the indicator. An example can be seen on Steem/USD chart below.
Exploring Fractals through Charts
In the previous section, we have discussed how various indicators can help us identify fractals on the chart and also how these indicators also help to spot buy and sell signals using fractals. In this section, we will be looking at how to identify fractals on the chart by our own observations.
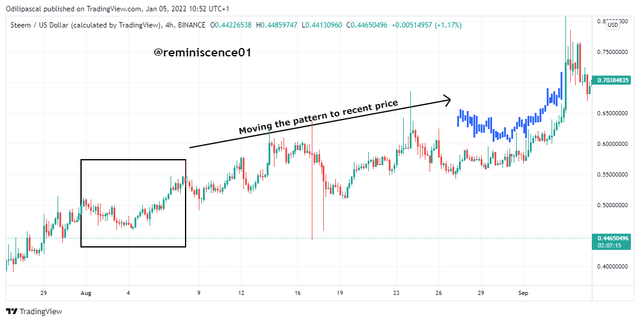
We always establish that fractals are repetitive patterns on the chart from past price data points. Here, we will be looking at a chart pattern in the past and comparing it with a recent price chart to check its similarity. Using the previous chart pattern can help us take advantage of the market when this same pattern unfolds in the present market.
This demonstration will be carried out on Tradingview platform on Steem/USD currency pair.
On the Tradingview chart interface, we will be using the Bar Pattern drawing tool located at the tool pattern to easily copy and paste a chart pattern. This can be seen in the screenshot below.
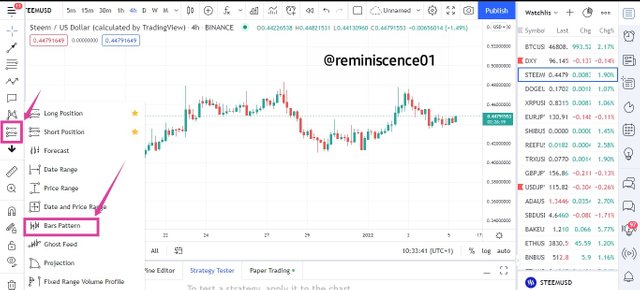
To activate the Bar Pattern, click on it and proceed to the chart to make your drawings. Click on any desired chart patterns and draw the line from left to right. This will capture the chart pattern of the selected range. This identified chart pattern can be moved along the chart to a current price point.
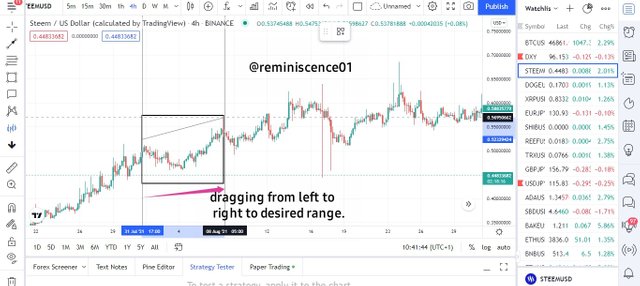
Now, I will drag this previous chart pattern to the recent price movement. This can be done by clicking and dragging the copy-pasted chart pattern to the present price.
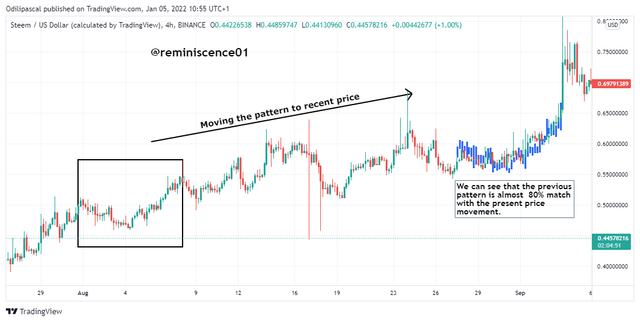
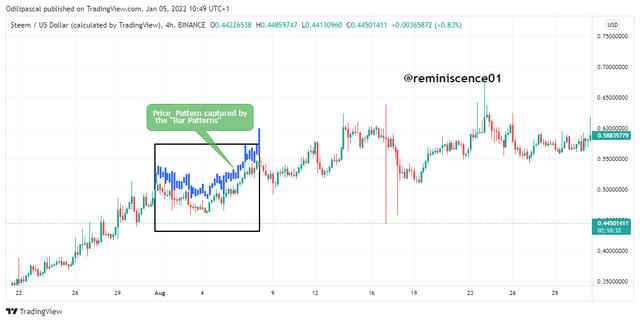
Looking at the chart above, we can see that the previous chart is almost 80% match with the current price movement. With the psychology of fractals that patterns are likely to repeat themselves in the market, we can easily predict the next market movement for price continuation without much effort.
In addition to this, we can just rely on the above illustration to make a trading decision. We can further confirm this market movement by using any other indicator or price reversal patterns for proper confirmation. For the case of trend reversals, the Fibonacci retracement tool can be used to identify price reversal points.
Understand that market conditions changes as well as demand and supply of assets. Also, the market makers are keeping tabs on fractals to manipulate the market as traders always expect similar price movements. Always ensure that you have proper confluence before making any trading decision.
Technical Analysis Identifying Fractals on the Chart and Maimf a real Purchase of a Coin
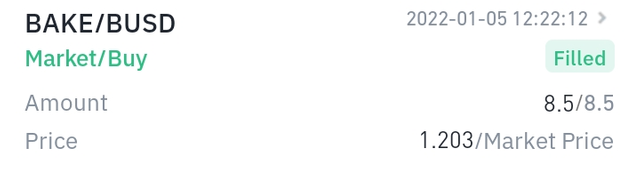
In this section, I will carry out a technical analysis using Williams Fractals Indicator on Bake/USD. The technical analysis will be carried out on Tradingview.com platform while the coin purchase will be executed on the Binance exchange.
To help increase the efficiency of my trade analysis with Williams Fractal indicator, I will be combining it with the Williams Alligator indicator as a confirmation tool and also traditional support and resistance will be deployed in the analysis.
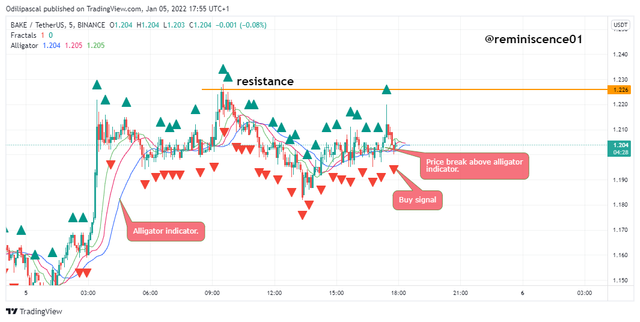
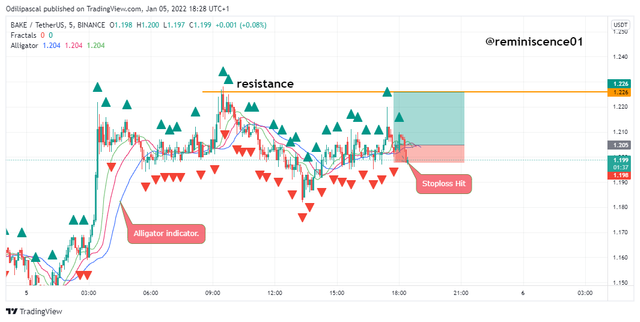
Looking at the chart above, we can see that price was trading below the Williams alligator which is a bearish signal. This shows that there is still selling pressure in the market. After some time, price broke above the Williams alligator which signals a change from bearish to bullish signal. On the other hand, the alligator has printed a bullish fractal indicated by a red arrow which also shows a bullish signal. I took a buy trade after price retraced to find support on the alligator.
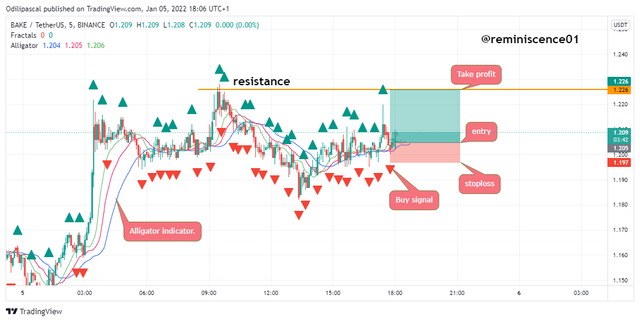
I deployed a 1:1 risk-reward ratio for this trade with stoploss placed below the Alligator indicator and take profit placed at the next resistance. I will be exiting the trade using any of the exit criteria indicated on the chart above.
The details of the trade can be seen in the screenshot below.
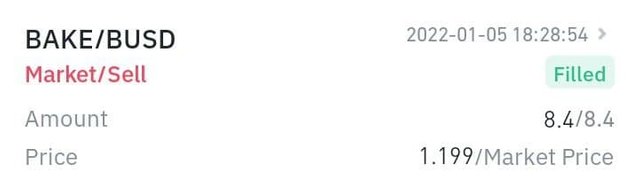
After some time, price came back down and hit my stoploss. I was automatically exited from the market. The bullish setup at this point has been invalidated as price broke below the Williams Alligator indicator.
Conclusion
Fractals are important trading tools that can be deployed to make good trading decisions and also to spot important chart patterns in the market. However, so many indicators have been developed with the basis of fractals using previous price data points to help spot fractals easily. The indicators are simple to interpret but cannot be fully relied on for making a trading decision. The effectiveness of using fractal indicators can be increased when it is combined with other technical analysis tools.
Thank you @reddileep for this amazing lesson.