Crypto Academy Season 3 Intermediate Level - Homework Post for WEEK 7: [HOW TO CREATE AN ACCOUNT ON TRADINGVIEW, HOW TO USE INDICATORS,TOOLS, FEATURES OF TRADINGVIEW] by @reddileep for Professor @yousafharoonkhan

HOMEWORK WEEK 7
Entire Question
- Question no 1:
Defining the TradingView site and how to register an account in tradingview? what are the different registration plan?(screenshot necessary)
- Question no 2:
Explain the different features of tradingView and what is your favorite feature and why?(screenshot necessary)
- Question no 3:
How to set up a chart in TradingView and use two tools to edit it.(screenshot necessary)
- Question no 4:
Explain how to add indicator in chart, what is your your favorite indicator and why? (screenshot necessary)
- Question no 5:
Do you think TradingView is useful in predicting the market for cryptocurrency (trend / price)?
- Conclusion


- DEFINING THE TRADINGVIEW SITE

- HOW TO REGISTER AN ACCOUNT IN TRADINGVIEW
STEP 1 -:
- First of all, we should get access to the https://tradingview.com/ website. We can use this URL or we can search for "TradingView" on any Search Engine like Google and Yahoo. After that, we have to select "TradingView – Track All Markets" website from the search result.
Below I've attached a screenshot of the Search Results for both search engines.

STEP 2 -:
- After that, we can click on the profile icon from the right, top of the website site. Then, we have to click on "Sign in" to open the sign-up option window. (Check the below-attached screenshot to get an idea)

STEP 3 -:
- Now we can see the popup login window. Through that, we can click on "Sign Up" from the bottom of the window. Then, the Sign In option changes to Sign Up and we can select Email as the regular Sign Up option. Furthermore, we can select any Social media icon as an additional and quicker login method. However, here I've defined the Email method as it is the regular registration method.

STEP 4 -:
- After that, we can fill the Registration Form according to our personal details. Here we have to fill our user name as the public user name on the TradingView site, Our working Email address and our desired Password. Then, we can put a tick on the "Terms of Use" agreement as an acknowledgement. Furthermore, we have to click on " I am not a robot" to do the captcha verification. After that, we can click on "Verify" and "Create account".

STEP 5 -:
- After clicking on "Create account", we have to open our email account to confirm the verification email sent by the Tradingview site. So, we can click on "Active account" from the given email. (Check the below-attached screenshot)

STEP 6 -:
- Finally, we can enter our First name, Last name and profile picture(Optional). Then we can click on "Continue" to flinish the registration. (Check the below-attached screenshot)

- WHAT ARE THE DIFFERENT REGISTRATION PLANS?
After the registration, we can see there are 4 registration plans on the TradingView site including the Free basic plan. If we need, we can try any of these packages for 1 month and we have to add our Credit or Debit card to the Tradingview site if we need to try all paid packages for a 1-month period.
Below I've attached a screenshot of the purchasable plans that I've taken from https://www.tradingview.com


Basic Plan :-
This is the only package that we can use without fees. As an apprentice, we can use a number of facilities subject to certain limitations. As an example, we can add only 3 indicators per chart in Basic Plan. However, as we can use customized indicators from the public library, we can use an indicator that has several features together. Furthermore, we can use many more such facilities in the basic plan and I have included information about some of them below.
» We can check Annual 7 years or quarterly 8 years historical financial data on any charts in the Basic plan.
» We can apply up to 1 active alert on price and indicators. therefore, we can be very careful about an order.
» We can use Crypto and currency screeners without auto-refresh facility with 1 Flagged symbol colour.
Pro Plan :-
This is a package that requires some payment and can be paid for as little as $ 14.95 per month or $ 155 per year. Somewhat professional traders use this package, which allows us to work without ads with more features than the basic package. Below I've defined some of the special features of this package.
» We can check Annual 20 years or quarterly 8 years historical financial data on any charts in the Pro plan.
» We can apply up to 20 active alerts on price and indicators. therefore, we can be very careful with more than one order.
» We can use Crypto and currency screeners with auto-refresh facility and can be added 7 Flagged symbols colours.
» Additionally, we can use 2 charts in one window. Therefore, we can focus on 2 coins at once.
Pro+ Plan :-
This is the second level paid package that can use more features than the Pro package. So, we have to pay $29.95 monthly or $299 yearly. Here too we can work without ads, especially with the ability to log in simultaneously from two devices. We can see most of the time this package is used by professional traders on the Tradingview site. Below I've also defined some of the special features of this package.
» We can check Annual 20 years or quarterly 8 years historical financial data on any charts in the Pro + plan.
» We can apply up to 100 active alerts on price and indicators. therefore, this is more useful than the above-mentioned packages.
» We can use Crypto and currency screeners with auto-refresh facility and can be added 7 Flagged symbols colours same like pro package
» Additionally, we can use 4 charts in one layout with 10 indicators per chart. Therefore, we can focus on 4 coins at once.
Premium Plan :-
This is an all-inclusive package with maximum opportunities on the Tradingview site. So, we have to pay $59.95 monthly or $599 yearly. High-level Traders use this package most of the time. Here we can use 5 devices at once with 4x more data in the charts. This package can be defined as the complete package for any trader. Below I've also defined some of the special features of this Premium package.
» We can check Annual 20 years or quarterly 8 years historical financial data on any charts in the Premium plan.
» We can apply up to 400 active alerts on price and indicators. therefore, this is more useful than the above-mentioned packages.
» We can use Crypto and currency screeners with auto-refresh facility and can be added 7 Flagged symbols colours same like pro and pro + package
» Additionally, we can use 8 charts in one layout with 25 indicators per chart. Therefore, we can focus on 8 coins at once.

- DIFFERENT FEATURES OF TRADINGVIEW
There are a lot of different features in TradingView site. Below, I've defined them separately.
GRAPH ANALYSIS OF FOREX OR CRYPTOCURRENCY
- This is the main feature of this platform. We are free to choose any currency pair and we can customize it according to our requirement using various types of indicators to the chart. We can use Bars, Candles, Hollow Candles, Line and Area to view the price movement of our selected currency pair graphically. And also, we can use a lot of inbuilt tools to customize or modify these charts like Cursors, Trend Lines, Geometric Shapes, Annotation Tools, Patterns and Prediction and Measurement Tools.
Below I've attached a screenshot of the STEEM/USDT Chart window using TradingView Site.

MARKET TYPES BY CATEGORY
- TradingView is a wide-ranged market analysing platform. So, we can see a lot of market types in this platform like Cryptocurrency, Fiat, Stock, Indices, Futures etc... And also, When we select one category from the given list, we can see all the details of that market including Prices, Ideas and Market cap. Additionally, we can see all the listed coins for the given category.
Below I've attached a screenshot of the Market Categories window using TradingView Site.

TRADING IDEAS
- This is another useful feature in the TradingView Site. Actually, this is a very important feature for an amateur trader. Because, when someone doesn't have much idea of the market, he can search for trading ideas from the TradingView site. So, a lot of professional traders have shared a lot of valuable trading ideas. However, we have to be a little more careful when looking for ideas as anyone can post any ideas. Therefore, we have to filter ideas before making decisions. As an example, we can follow premium users or users who have a high reputation and followers. Likewise, we can get support from these features.
Below I've attached a screenshot of Trading Ideas window using TradingView Site.

SCRIPTING LANGUAGE
- This is a very special feature of this platform. Actually, there is another separate scripting language for this platform called Pine Script From this programming language, anyone can design any indicator on the TradingView site. And also, anyone can customize these indicators accordingly. So, this is a very unique feature to develop and create new indicators.
Below I've attached a screenshot of Quickstart guide of this feature using TradingView Site.

WHAT IS MY FAVOURITE FEATURE
- As I described earlier, there are a lot of features in the TradingView platform. Among them, I really interested in the Pine Script Programing language. If we need to be successful in this trading field, we have to understand the correct behaviour of the market. Therefore, we have to get support on various types of indicators. So, if we are able to, create an indicator using this feature, we can be success definitely. Because we have to study every calculation and other things to design those indicators. And also, if we know this scripting language well, we can create any indicator according to our personal needs using this scripting language and it will be more familiar to us than other indicators.
Below I've attached a sample image of Pine Script Programing language.
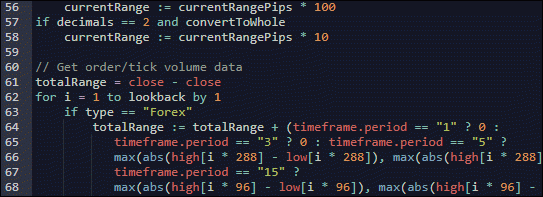
Image Source

- SET UP A CHART IN TRADINGVIEW
STEP 1
- First of all, we have to get access to the https://www.tradingview.com. Then, we can click on "Chart" to open the chart window. (Check the bellow-attached image to get an idea)

STEP 2
- Now we can select any currency pair according to our needs. So, we can type it in the Symbol Search Bar. Here I've selected STEEM/USDT pair to open the chart window. (Check the bellow-attached image to get an idea)

STEP 3
- After that, we can see the STEEM/USDT chart window has displayed in front of our screen. Below, I've attached a screenshot of the STEEM/USDT Pair chart window.

- EDIT CHART FROM CHART SETTINGS TOOL
STEP 1
- Now we can use Tools in the TradingView site to edit these charts. First of all, I would like to change the appearance of the charts. Therefore, here I've clicked on the "Chart Properties" icon from the top right of the tool panel. Then, we can open the "Chart Settings" window. Here we can change the Colours of the symbols, Status line details, Scales, Appearance and trading related details. We can change anything according to our choice and finally, we can click on "OK" to apply settings. (Check the below-attached image)

STEP 2
- Here I've applied some changes to the chart window. I've changed Bullish candlesticks colours to Blue colour and Bearish candlesticks color to dark red color. And also, I've changed the background colour to highlight candlestick patterns clearly.

- EDIT CHART USING PARALLEL CHANNEL TOOL
STEP 1
- This is another useful tool on the TradingView site. We can select this tool from the left tool panel like to below-attached screenshot.
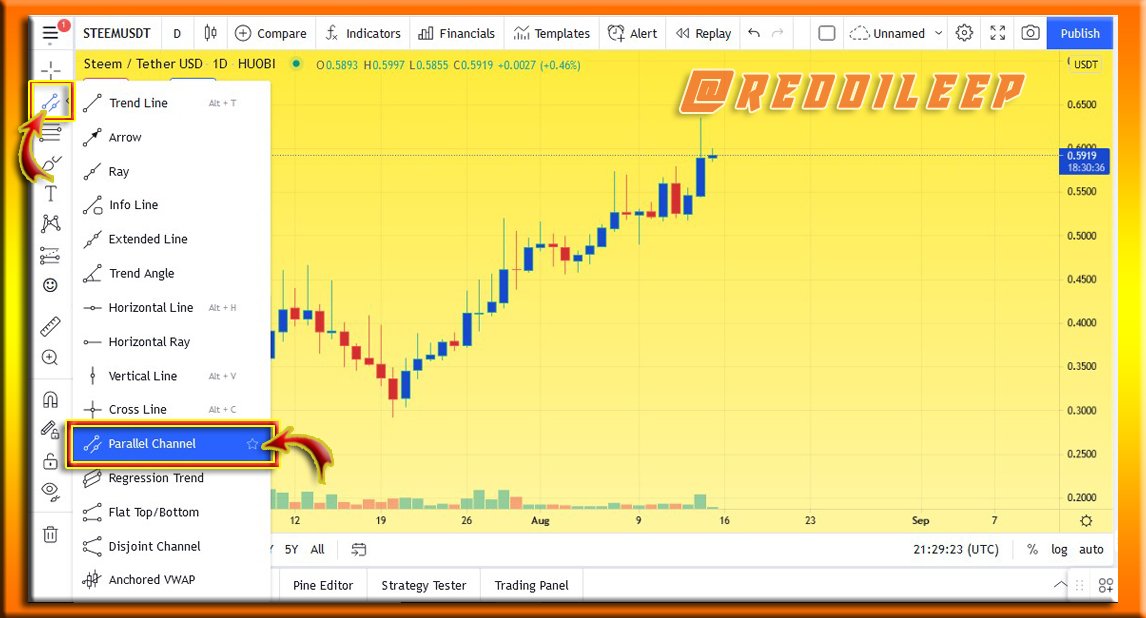
STEP 2
- Now, we can write a line like a trend line using this tool. But we can draw two parallel lines correctly and easily at once. So, we can use this tool to identify Support and Resistant lines easily. Below I've attached a screenshot of this Parallel Channel tool.


- HOW TO ADD INDICATOR IN CHART (Parabolic SAR Indicator)
STEP 1
- As the first step for adding indicators to our chart, we have to click on the "Indicators & Strategies" icon to open the Indicators & Strategies window. Then we can type the name of any required indicator from the given search bar. I've selected Parabolic SAR Indicator for my demonstration. (check the bellow-attached screenshot to get an idea)

STEP 2
- Now, we can see "Parabolic SAR Indicator" has been added to the chart window. If we need, we can edit this indicator according to our needs. For that, I have to click on the Settings icon from the indicator like the below-attached screenshot.

STEP 3
- After that, we can customize this indicator. Here I've increased the thickness of this indicator to highlighted it well. Finally, we can click on "OK" to apply those settings. (check the bellow- attached screenshot)

STEP 4
- Below we can clearly see "Parabolic SAR Indicator" added to the chart window.

- MY FAVORITE INDICATOR
Parabolic SAR Indicator is my favourite indicator. Because I am personally using it to make decisions before place an order in the Cryptocurrency market. And also, this indicator has often helped me to make the right decisions.
It is very easy to use in day to day trading. We can use it to identify the correct entry point to the market or the correct exit point for the market. When the dotted line starts to indicate below the market prices, it means it is a good signal for a strong bullish market. And also, when the dotted line starts to indicate above the market prices, it means it is a good signal for a strong bearish market. Therefore, we can keep the focus on this dotted line in our chart and we can make the right decisions most of the time. However, we have to be careful when using every indicator.
Bellow I've attached a screenshot of STEEM/USDT Pair chart window with Parabolic SAR Indicator to explain it clearly.


According to my idea, TradingView is very useful in predicting the market for Cryptocurrencies and other currencies like Fiat. As we use this TradingView site to make predictions about any pair of coins, we can see a number of very significant adjustments when looking graphically at how crypto market prices are behaving today and in the past. We already know, there are a lot of useful indicators on the TradingView site. So, if we are able to use them correctly according to our coin pair, we have a significant percentage to reap the benefits for our investment.
However, we all know that Cryptocurrency is a very volatile market due to high buying pressure or selling pressure in the market. Therefore, in some cases, large losses can occur. Then, we have to manage our investment and we have to analyze charts well before taking a decision.
When you look at the market trends in the chart, there may be some setbacks in a continuously rising market. This is because prices sometimes go up or down according to certain corrections. Therefore, we have to keep all these things in our mind before entering to the Cryptocurrency market.

As I described earlier, TradingView is a very useful site to accomplish our trading purposes in a great manner. As a beginner, we can use this site to learn many more things about the Cryptocurrency world. And also, this site has a lot of other features besides chart analysis and prediction. First of all, we should improve our experience on this TradingView site using various types of charts and other features. Then we can gain maximum results through our experience.
This is all about my homework and I really appreciate Professor @yousafharoonkhan for your valuable lesson and your dedication to creating a very essential lesson for us. Usually, this lesson is really important to my life as I am still trading in the cryptocurrency market.

Thank you..
Respected first thank you very much for taking interest in SteemitCryptoAcademy
Season 3 | intermediate course class week 7
thank you very much for taking interest in this class
Thank you for your feedback professor 👍