Crypto Academy Season 3 Beginners’ Level - Homework Post for WEEK 4: [CANDLESTICK PATTERNS] by @reddileep for Professor reminiscence01
HOMEWORK WEEK 4
Entire Question
1. In your own words, explain the psychology behind the formation of the following candlestick patterns.
- Bullish engulfing Candlestick pattern
- Doji Candlestick pattern
- The Hammer candlestick pattern
- The morning and evening Star candlestick pattern.
2. Identify these candlestick patterns listed in question one on any cryptocurrency pair chart and explain how price reacted after the formation. (Screenshot your own chart for this exercise)
3. Using a demo account, open a trade using any of the Candlestick pattern on any cryptocurrency pair. You can use a lower timeframe for this exercise.(Screenshot your own chart for this exercise).


- Introduction of Bullish engulfing Candlestick pattern
- Psychology Behind the Formation of this Pattern
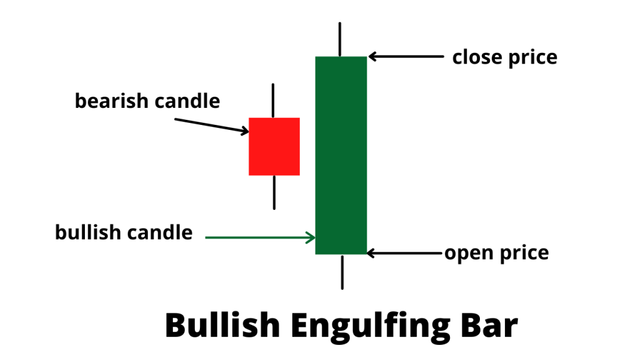
Formation of this Bullish engulfing Candlestick pattern needs a Green Candle behind the Red candle. Also, the Green candle should be larger than the Red candle in every way. If I explain it clearly, the opening price of this Green candle should be less than the closing price of this Red candle. And also, the closing price of this Green Candle should be larger than the opening price of the Red Candle. So, we can clearly understand and recognize these patterns according to the candlestick charts. Therefore, it is very useful for every trader to imagine the next behaviour of the price movement.
Below I have attached a screenshot of my TradingView account and I have highlighted some of Bullish engulfing Candlestick patterns clearly. As I described above, we can see the trend of the market has changed to a bullish trend after occurring this pattern.


- Introduction of Doji Candlestick pattern
- Psychology Behind the Formation of this Pattern
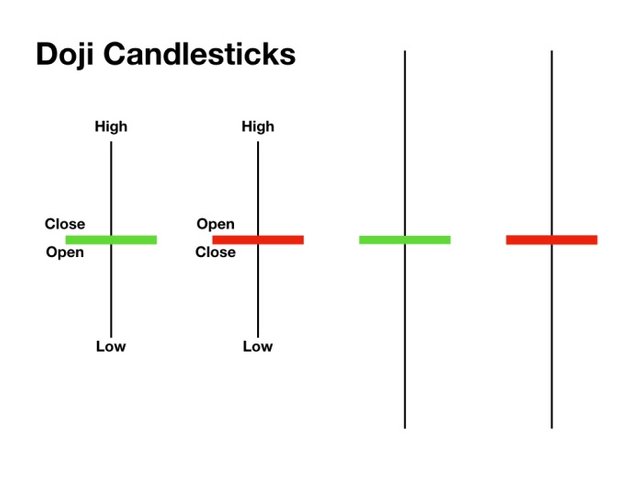
What has really happened here is that buyers have not been able to put good buying pressure and sellers have not been able to put good selling pressure. When we are in a market of continuous growth, if we see this Doji candle we can infer a tendency for the price movement to fall. And also when we are in a downtrend market, if we see this Doji candle, we can guess that the price movement can be changed to an Uptrend. Therefore, we can look at this candle pattern and decide whether to enter the market or leave the market at the correct time.
Below I have attached a screenshot of my TradingView account and I have highlighted some of Doji Candlestick patterns clearly.

- Further, there are 5 types of commonly traded Doji Patterns.
STANDARD DOJI
- This is the standard type of this Doji Candlestick Pattern and we can see the above-explained shape from this Candle. Basically, without body and normal size of verticle line and horizontal line.
LONG-LEGGED DOJI
- This candle looks quite a bit the same as Standard Doji Candle. But here we can see a more extended Verticle line as compared to the standard Doji candle. Also, we can clearly determine the indecision between the buyers and the sellers.
DRAGONFLY DOJI
- In a Dragonfly Doji candle, we can clearly see a "T" shape from the Candle and there is no line above the horizontal bar. Also, the lower wick is longer, and if this candle can be seen at the bottom of a bearish trend, we can see a change in trend from bearish to bullish.
GRAVESTONE DOJI
- This can be described as an attempt by buyers to push up the market price. But, it is not a successful attempt as the candle couldn't close at a proper level. Therefore, we can assume that the market price will continue to fall from here.
4-PRICE DOJI
- Here we can't see a vertical line from this Doji candle. There is only a single horizontal line in this 4 Price Doji candle and it represents all four prices at the same point (high, low, open and close) Therefore, this is an extreme indecision situation for the market.

- Introduction of Hammer Candlestick pattern
- Psychology Behind the Formation of this Pattern
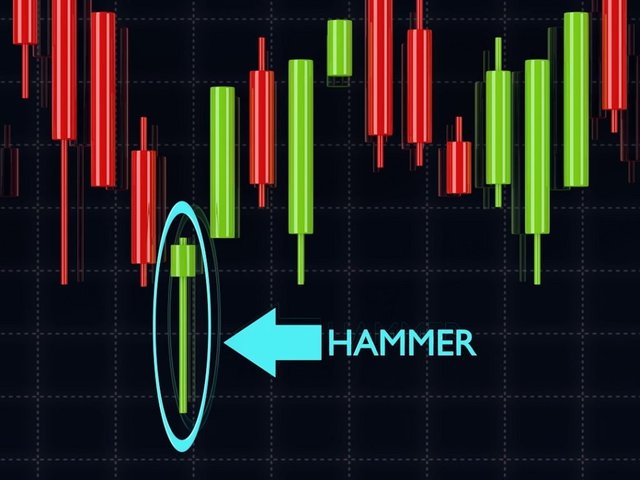
We already know that when the sellers have the majority in the market, market prices continuously fall. Therefore, we can clearly see a downtrend market. Then we can see the opening price is starting from the top of the candle and it gradually pulling down to the bottom of the candle. It means sellers are selling their coins very fastly. After the price came to the lowest price level, buyers come to the market and push the price movement upwards. Then the price movement gradually goes up and it passes the starting price of the candle. Further, the candle closes like a hammer shape and other traders can determine the future behaviour of the market according to this candle. However, it may be better to wait until another candle rises before making a decision.
Below I have attached a screenshot of my TradingView account and I have highlighted some of Hammer Candlestick patterns clearly.


MORNING STAR CANDLESTICK PATTERN
- Introduction of Morning Star Candlestick pattern
- Psychology Behind the Formation of this Pattern
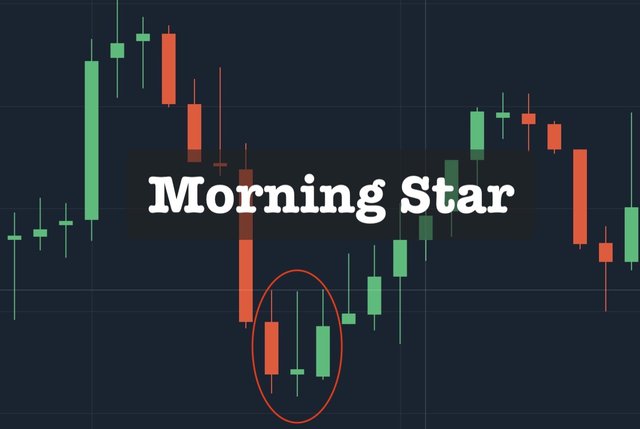
Several key factors are needed to create this candlestick pattern. Those are,
The market should come in a clear recession to form this pattern.
The bottom of this candlestick pattern should touch a support line.
Including the above-mentioned factors, there should be mainly 3 candlesticks, Red candle (Bearish candle), Long wick shorter body candle and last candle should be a larger Green candle (Bullish candle)
Further, the first Red candle (Bearish candle) represents the strength of the sellers as compared to the buyers. Therefore, market price movement should be continuously decreased. After that, the second Long wick shorter body candle represents the indecision situation in the market. So, we can imagine it as the sellers begin to allow buyers in the market. Then the 3rd larger Green candle confirms the way of buyers in the market and we can take decisions according to this candle. So, most of the time, this can be a signal of an uptrend.
Below I have attached a screenshot of my TradingView account and I have highlighted the Morning Star Candlestick pattern clearly.

EVENING STAR CANDLESTICK PATTERN
- Introduction of Evening Star Candlestick pattern
- Psychology Behind the Formation of this Pattern
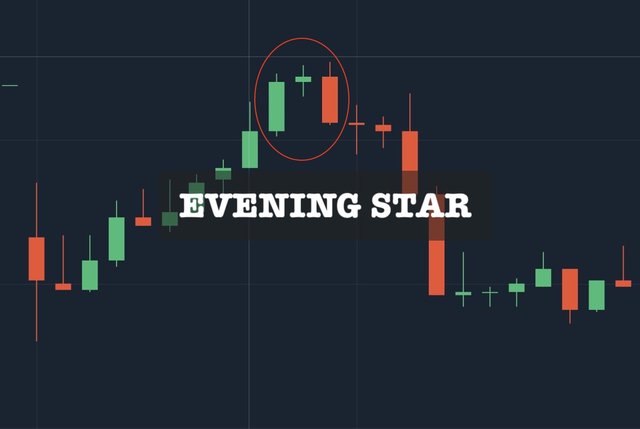
Actually, this Evening Star candlestick pattern is the opposite of the Morning Star candlestick pattern. So, several key factors are needed to create this candlestick pattern. Those are,
The market should come in a clear upswing to form this pattern.
The top of this candlestick pattern should touch a resistance line.
Including the above-mentioned factors, there should be mainly 3 candlesticks, Green candle (Bullish candle), Long wick shorter body candle and last candle should be a larger Red candle (Bearish candle)
Further, the first Green candle (Bullish candle) represents the strength of the buyers as compared to the sellers. Therefore, market price movement should be continuously increased. After that, the second Long wick shorter body candle represents the indecision situation in the market. So, we can imagine it as the buyers begin to allow sellers in the market. Then the 3rd larger Red candle confirms the way of sellers in the market and we can take decisions according to this candle. In such a situation the market is likely to suffer a major downtrend.
Below I have attached a screenshot of my TradingView account and I have highlighted the Evening Star Candlestick pattern clearly.


Below I have attached a screenshot of my TradingView account and I've selected BTC/USDT pair to show the price reaction.

From the above image, we can realize that after the formation of the Bullish engulfing Candlestick pattern, the downtrend price movement has changed to an uptrend. So, we can clearly recognize it, this pattern has occurred during a bearish market and it changed the market behaviour to a bullish market. So, we can imagine that buyers have gained market power.
Below I have attached a screenshot of my TradingView account and I've selected BTC/USDT pair to show the price reaction.

From the above image, we can realize that after the formation of the Doji Candlestick pattern, the downtrend price movement has changed to an uptrend and an Uptrend price movement has changed to a downtrend. So, we can clearly recognize it, this pattern has occurred a reversal in the market. It means if we see this Doji Candlestick pattern during a downtrend market, the future behaviour of the market can be bullish and if we see this in an uptrend market, the future behaviour of the market can be bearish.
Below I have attached a screenshot of my TradingView account and I've selected BTC/USDT pair to show the price reaction.

From the above image, we can realize that after the formation of the Hammer candlestick pattern, the downtrend price movement has changed to an uptrend. So, we can clearly recognize it, this pattern has occurred during a bearish market and it changed the market behaviour to a bullish market. So, we can imagine that buyers have gained market power and price movement of the market can be increased due to high buying pressure.
- MORNING STAR CANDLESTICK PATTERN
Below I have attached a screenshot of my TradingView account and I've selected BTC/USDT pair to show the price reaction.

From the above image, we can realize that after the formation of the Morning Star candlestick pattern, the downtrend price movement has changed to an uptrend. So, we can clearly recognize it, this pattern has occurred during a bearish market and it changed the market behaviour to a bullish market. So, we can imagine that buyers have gained market power and price movement of the market can be increased due to high buying pressure.
- EVENING STAR CANDLESTICK PATTERN
Below I have attached a screenshot of my TradingView account and I've selected BTC/USDT pair to show the price reaction.

As I discussed above, this is the opposite of the morning star candlestick pattern. So from the above image, we can realize that after the formation of the Evening Star candlestick pattern, the uptrend price movement has changed to a downtrend. So, we can clearly recognize it, this pattern has occurred during a bullish market and it changed the market behaviour to a bearish market. So, we can imagine that sellers have gained market power and price movement of the market can be decreased due to high selling pressure.

Here I've used Binance exchange to open this trade as I am using personally. First of all, I transferred 25$ from my spot wallet to Binance futures wallet. Then I thought to open a trade using BNB coin and 10X leverage. So, when I was waiting for the correct time to open the trade, I recognized the Morning Star candlestick pattern has appeared. Therefore, I roughly guessed that the declining market could move up.
Below we can see my idea of this trade. (Screenshot taken from Binance Trading window)

According to the above chart, here I've placed an order (Buy long Order). Actually, I could place the order at 300.740 as the Entry price. Now we can see my unrealized profit +2.34$. However, I can see the overall trend is an uptrend. So I think I can close the order from the expected profit.


We must have practical knowledge as well as theoretical knowledge of this pattern. So, the above-mentioned candlestick charts are very helpful to get an accurate idea for our analysis. We have to understand important candlestick patterns well and we can enter the market at the correct time. Most of the time it is safest to wait until the next candle is occurred before making a decision. Because it is difficult for us to come to a definite conclusion by looking at candle patterns.
This is all about my homework and I really appreciate Professor @reminiscence01 for your valuable lesson and your dedication to creating a very essential lesson for us. As I said earlier, this lesson is really important to my life as I am still trading in the cryptocurrency market.

Thank you..
Hello @reddileep , I’m glad you participated in the 4th Week of the Beginner’s class at the Steemit Crypto Academy. Your grades in this task are as follows:
Recommendation / Feedback:
You have a very good presentation and i commend your writing skills. Similarly, your explanations are superb.
Thank you for completing this homework task.
Thank you very much for your feedback professor 👍