Crypto Academy Season 3 Beginners’ Level - Homework Post for WEEK 3: [ALL ABOUT TRENDS, SUPPORTS AND RESISTANCES AND SIMPLE CHART PATTERNS] by @reddileep for Professor lenonmc21

HOMEWORK WEEK 3
Entire Question
Define in your own words what is a "Trend" and trend lines and what is their role in charts?
Explain how to draw an uptrend line and a downtrend line (Show a screenshot of each).
Define in your own words what "Supports and Resistances" are and how we can identify both zones (Show a screenshot of each one).
Explain in your own words at least 2 simple chart patterns with screenshots.

WHAT IS A "TREND"
When we see the price movement of the market goes one side continuously, we can define it as a Trend. So, a Trader can gain more profit when he trades from the beginning of a Trend. Therefore, it is very important to have a good knowledge of the trend
MAINLY THERE ARE 2 TYPES OF TRENDS
An Up Trend or Bullish Trend
Down Trend or Bearish Trend

- Basically, an Up Trend is the most important thing to increase the value of any Cryptocurrency or Fiat. Here we can see a large number of buyers in a market and the direction of the price movement goes upward. Because the price is increasing and Traders are attracted to buy more coins. And also, in an Uptrend market, we can see the next candle is higher than the previous candle most of the time.
Below I have attached a screenshot of Up Trends through Tradingview


- Basically, a downtrend is caused by a rapid drop in price movement. Here we can see a large number of traders are selling their cryptocurrency or fiat rapidly and the direction of price movement goes downward. Most of the time, we can see the next candle is lower than the previous candle in a downtrend market.
Below I have attached a screenshot of Down Trends from Tradingview


WHAT ARE "TREND LINES"
Trend lines are the markings used by Traders to identify the price movement of the market. By this, traders can recognize the future behaviour of the market to determine their investment. And also, we use maximum or minimum points to mark these lines according to the upward or downward trends. Therefore, in an Upward trend, we use minimum points to draw the Trendline and in a downward trend, we use maximum points to draw the Trendline. So we draw these trend lines marking at least two of the lowest or highest places
Below I have attached a screenshot of Trend lines from Tradingview

MAINLY THERE ARE 2 TYPES OF TREND LINES
Uptrend Lines
Downtrend Lines

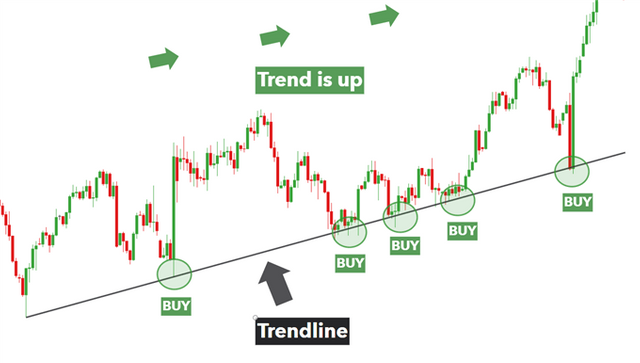
- Basically, we can draw Uptrend lines using the lowest opportunities in a rising market. (Higher Lows) Here we can see the second low is higher than the first low. So, after drawing a line connecting at least three lower points in an uptrend, we can determine the future behaviour of the market price. Then, if we see a break below the line, we can decide on a change in the price movement.

- Basically, the uptrend line is drawn using the top points of the down market. (Lower highs) Here we can see the second high is lower than the first high. So, after connecting at least three higher points in a downtrend, we can determine the future behaviour of the market price same like uptrend lines. Then, if we see a break above the line, we can decide on a change in the price movement. It means, it can be changed to an uptrend.
WHAT IS THEIR ROLE IN CHARTS?
- Trends and Trend Lines have a significant contribution to the charts. Because, if we want to enter to the market, we have to do a better analysis. So, we need charts to analyze the market understanding the trend and drawing trend lines. It means, we use these trends and trend lines as a tool to get an idea of the market behaviour using charts.
Furthermore, we use these trend lines in a chart using several types of graph lines.
- Linear
- Polynomial
- Exponential
- Logarithmic
- Power
It is very important for a successful trader to have a good knowledge of the trend line types mentioned above.

HOW TO DRAW AN UPTREND LINE
Basically, there are two methods to draw the uptrend lines. That is using Higher Highs and Higher Lows. Sometimes we use both lines together to draw the Uptrendlines. However, Higher Highs we use to identify resistance lines and Higher Lows we use to identify support lines.
Before drawing a Trend line, we need to have an idea of the market trend. So, here I have considered Higher Lows mostly to draw the uptrend line. Below I have explained it step by step.
STEP 1
Here I have selected candlestick charts to draw the Uptrend line. Because Candlestick charts are better to identify trends and draw the trend lines. Then we have to identify the correct uptrend pattern and at least three Higher low points. If we use higher time frame, it will be easier to identify trends clearly.
So, below I have attached a screenshot of the Uptrend Pattern that I selected using BTC/USDT chart through the TradingView site

STEP 2
After identifying the exact uptrend and exact points, we can draw the trend line combining each suitable Higher Low point. Further, we can use both Wicks or Candles to draw the lines. However, we can draw the line crossing wicks of the candles. But we can't cross the body of the candle to keep the accuracy of the trendline.
So, below I have attached another image of drawing the trend line using Higher Lows through the TradingView site

HOW TO DRAW A DOWNTREND LINE
Same as Uptrend, we can see two types of drawing downtrend lines. That is using Lower Highs and Lower Lows. So we use either Lower Highs or we can use both like a Channel.
Here I have considered Lower Highs mostly to draw the downtrend line. Below I have explained it step by step.
STEP 1
First of all, I need to identify the correct Downtrend Pattern and at least three accurate Lower High points.
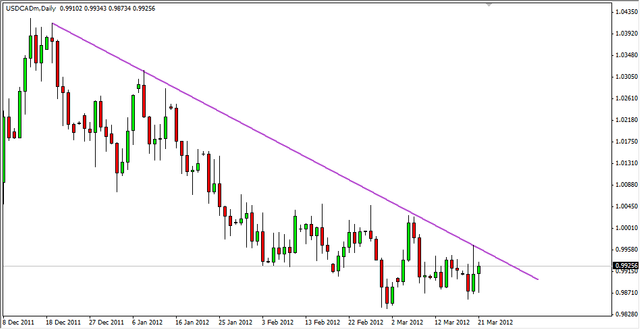
So, below I have attached a screenshot of the Downtrend Pattern that I selected using BTC/USDT chart through the TradingView site

STEP 2
After identifying the exact Downtrend and exact points, we can draw the trend line combining each suitable Lower High point. Further, same as Uptrend, we can use both Wicks or Candles to draw the lines for a Downtrend Line.
So, below I have attached another image of drawing the trend line using Lower Highs through the TradingView site


WHAT ARE "SUPPORTS"?
- Support and Resistances are the main parts of technical analysis. When the prices fall rapidly, we can see several levels where buyers are so interested to buy. So when prices fall to that level, a lot of buyers enter the market to create buy orders. Then a demand zone is created at this level. Prices that were falling now will stop coming down from there. That means it gets support and we define it as a support level. Further, the prices bounce from that level and move upward.
WHAT ARE "RESISTANCES"?
- When the prices rise rapidly, we can see several levels where sellers are so interested to sell their coins. Actually, this is the opposite of supports. Because when prices increase to that level, a lot of sellers enter the market to create sell orders. Now, it creates a supply zone at this level. Prices that were increasing now will stop coming up from there. That means it gets resistance and we define it as a Resistance level. Further, the prices bounce from that level to downward.
HOW WE CAN IDENTIFY BOTH ZONES?
We can easily identify supports and resistance through charts. First of all, we can change our time frame to a higher time frame to recognize strong price movements.
Basically, to identify support levels, we look at the levels at which prices have risen again and again. Then we look at the levels at which the price has been rejected and it is considered as a resistance level.
Below I have attached a screenshot of drawing the support and resistance through the TradingView site

- Also, we should remember some important things, which are when the resistance level breaks at a certain time, this resistance level begins to work as a support level. Then when the support level breaks at a certain time, this support level begins to work as a resistance level. Those matters are very important to identify both zones.

ASCENDING TRIANGLE
- Basically, we use a triangle shape to identify price patterns using a horizontal line as a resistance line and an Uptrend line as a support line. Here we can see the resistance line and uptrend line connect each other. So, a trader can take decisions easily according to the Ascending Triangle. Most of the time, we can see a rise in the market after a successful break of the resistance line in the ascending triangle. Also, if the support line of the Ascending Triangle breaks, we can see a bearish market. This means that buyers or sellers look at these patterns and continue to create their purchase orders or sell orders.
Below I have attached an image of Ascending Triangle which was created by me through the PowerPoint Program.

DESCENDING TRIANGLE
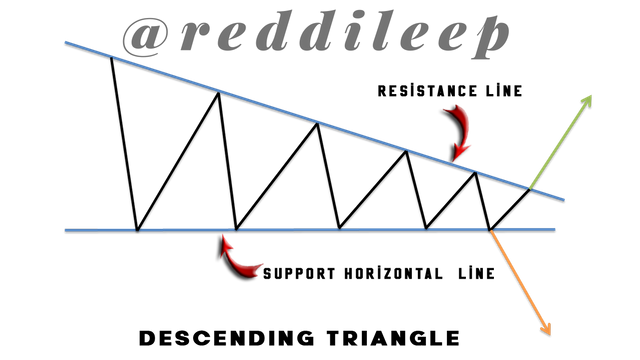
- Descending Triangle is the same as Ascending Triangle but here we can see an overall downtrend and the horizontal line acts as a support line. Also, a downtrend line acts as a resistance line. So, As price levels continue to fall, we can see a change in the price pattern where the resistance line and the support line meet. Actually, when the horizontal support line breaks, the price movement can be rapidly bearish and when the downtrend resistance line breaks, we can see a rapid bullish market. This means that buyers or sellers continue to create their purchase orders or sell orders according to the Descending Triangle pattern.
Below I have attached an image of Descending Triangle which was created by me through the PowerPoint Program.

At present, Trend lines have a significant contribution to the trading field. Every trader must have adequate knowledge of these trend lines and chart patterns before entering the market. So, we should have the ability to identify correct chart patterns according to our knowledge. Then, if we do an accurate analysis, we can create a successful order to earn an income.
This is all about my homework and I really appreciate Professor @lenonmc21 for your valuable lesson and your dedication to creating a very essential lesson for us.

Thank you..