Crypto Academy Season 3 Beginners’ Level - Homework Post for WEEK 2: [INTRODUCTION TO CHARTS] by @reddileep for Professor Reminiscence01
HOMEWORK WEEK 2
Entire Question
- Explain the Japanese Candlestick Chart? (Chart screenshot required)
- Describe any other two types of charts? (Screenshot required)
- In your own words, explain why the Japanese Candlestick chart is mostly used by traders.
- Describe a bullish candle and a bearish candle identifying its anatomy? (Screenshot is required)

- INTRODUCTION FOR THE JAPANESE CANDLESTICK CHART
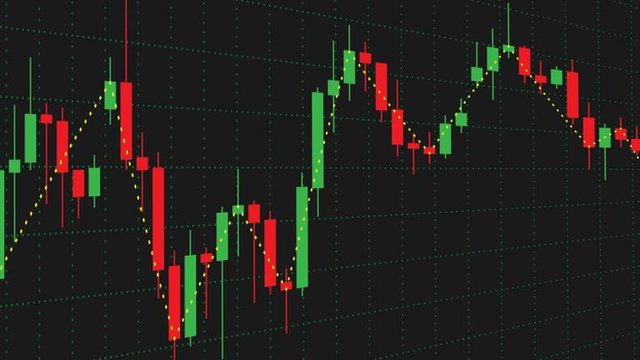
Japanese Candlestick Chart is the most popular and most useful chart that we use for trading. Basically, we can use various types of candle patterns to get an idea of the market graphically. Actually, here we mostly consider the price movement of the market. So, according to the price movement of any cryptocurrency or Fiat currency, there are 4 types of points. Those are open, close, high, and low points. They are wonderfully illuminated by these Candlestick charts. Below I have defined them briefly.

- HOW JAPANESE CANDLESTICK CHART WORKS
We all know that cryptocurrency is a big volatile market. So, we can't to the crypto market without getting adequate knowledge. Otherwise, all our money will be wasted. Therefore, most traders use these candlestick charts for predicting the next market by technical analysis.
Basically, there are 2 types of candles we consider for trading.

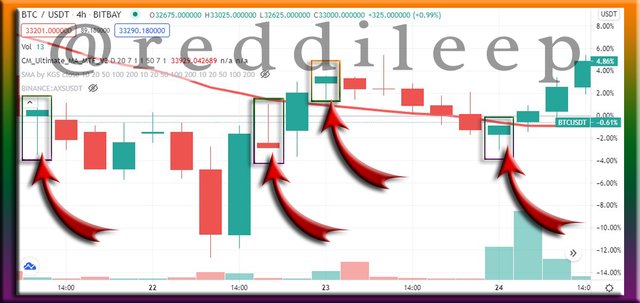
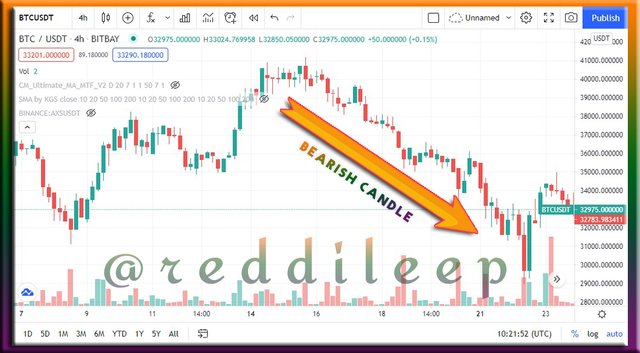
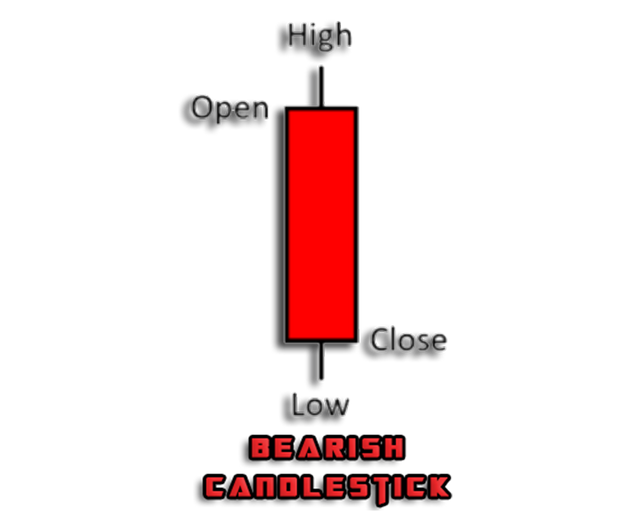
This indicates a decrease in market prices. We always read this Red Candlestick from top to bottom. It means Red Candlestick always opens from the top and close from the bottom.
Below I have attached a screenshot of my TradingView account and I have highlighted Red Candlesticks separately. We can see a lot of Red Candlesticks in a downtrend market like below-attached screenshot.

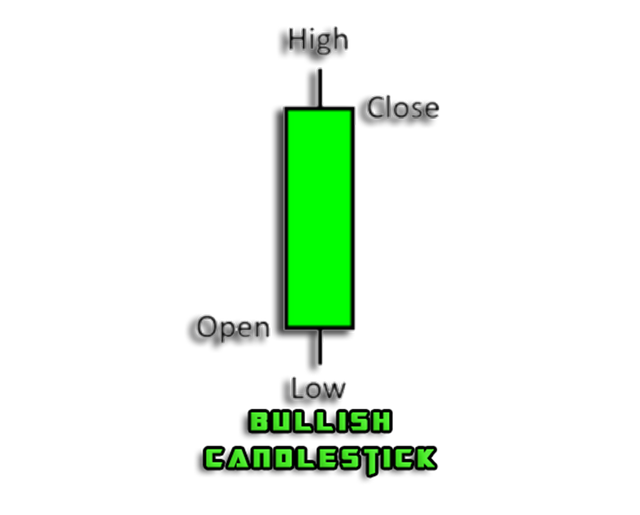
This indicates an increase in market prices. We always read this Green Candlestick from bottom to top. It means Green Candlestick always opens from the bottom and close from the top. It basically reverses Red Candlestick.
Below I have attached another Screenshot that showing Green Candlestick and here we can see an uptrend Market. So, we can realize that we mostly see a lot of Green Candlesticks in an uptrend market.
Further, we can identify four parts of this Japanese candlestick.
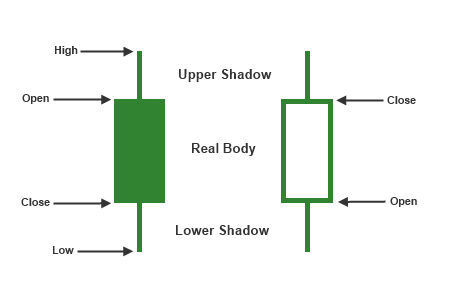
OPEN - We can see this part at the top of a price decreasing chart and the bottom of a price increasing chart. This basically, starts the price movement and it records within a specific time duration.
CLOSE - This is the reverse of the open. it means, we can see it at the top of a price increasing chart and bottom of a price decreasing chart. It represents the last price of a candle.
HIGH - Somewhat after the quoted price indicated by a candlestick, this will be the last price. Also, a high price will be indicated after a bit or big shallow from the candlestick to the top.
LOW - This is the reverse of the High. Because after the quoted price indicated by a candlestick, this will be the lowest price. Also, a low price will be indicated after a bit or big shallow from the candlestick to the bottom.
IMPORTANT CANDLESTICK PATTERNS
There are many candlestick patterns that we use for trading. Among them below I have explained two of my favourite patterns which I used for trading personally.
- THE DOJI CANDLESTICK
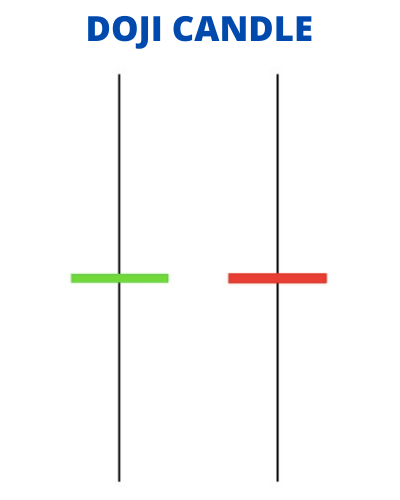
In fact, when we see the market at an uptrend, we can determine that if we see this doge candle, the market will turn into a recession. So, the same as when we see the market at a downtrend, we can determine that if we see this doge candle, the market will turn into an uptrend. Therefore, this Doji candle is very helpful to make decisions of market entry or exit from the market.
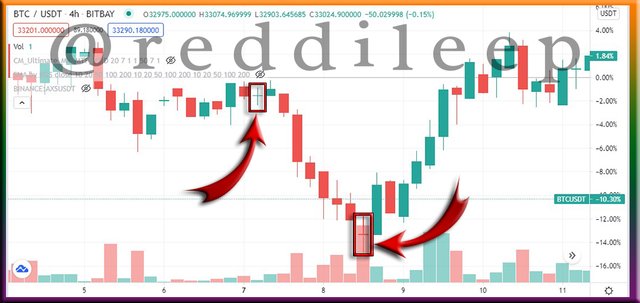
Below I have highlighted some the examples through my Tradingview account.
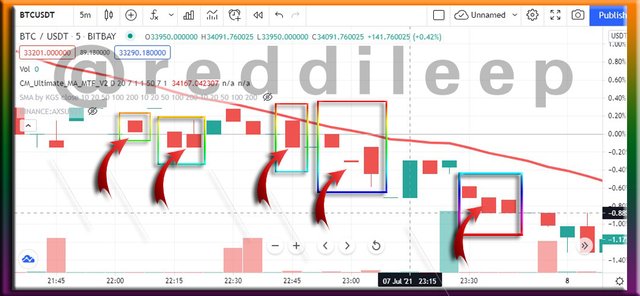
- THE HAMMER & HANGING MAN
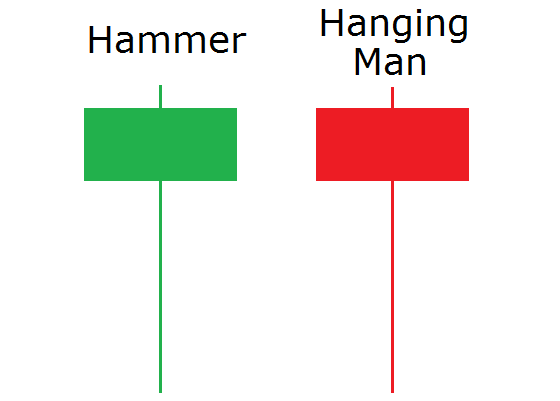
Actually, the stick of the Hammer or Hanging man should be about twice as large. And also, there can be no stick above the body. So, basically, we can see both candles as a hammer. If we see this Hammer candle in a downtrend market (Bearish market), we can take two decisions. One is, this market can be reversed again and it can be an uptrend. Other is, this market can be a volatile market.
So, if we see this Hanging Man candle in a market uptrend, we can also take two decisions. One is the market can be a downtrend and the other is the market can volatile market. So, that is the best time to sell our coins and make a profit.
Below I have highlighted some examples through my Tradingview account.

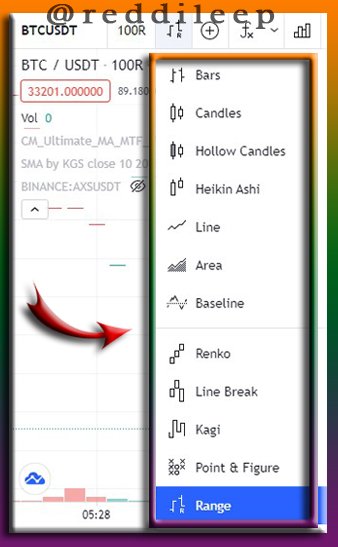
However, most of the time all the same is used to represent the ups and downs of prices in the market. But each chart represents different graphical interfaces.
Here I have attached a screenshot (Image on the right) using my Tradingview Tools panel and below I have defined my two of favourite charts including screenshots.
- BAR CHART
Bar charts are looking very simple and easy to understand the behaviour of price and time. Actually, it has horizontal and vertical axes and the horizontal axis indicates time and the vertical axis represents price in the market.
Below I have included a screenshot that showing bar charts in my Tradingview account pannel.
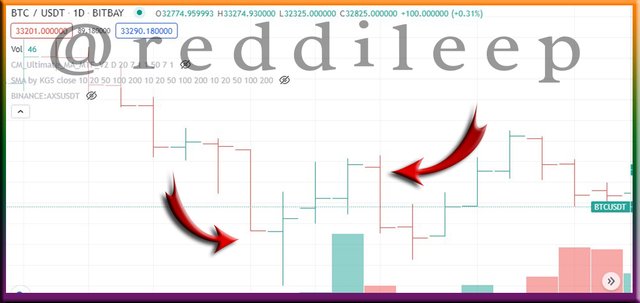
** Let's look at a close look of the Bar chart**
There is a range for this Bar. Generally, we define it as the difference between the highest and lowest price. Here open means the top of a price decreasing chart and the bottom of a price increasing chart. And also, Close means the top of a price increasing chart and bottom of a price decreasing chart. Basically, it is the same as the candlestick chart.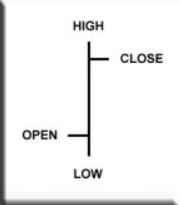
- LINE CHART
The line chart is the standard chart that we use to see the behaviour of the price in the market. Actually, it represents the price of the market in any Crypto or Fiat using lines graphically. This chart is very helpful to take decisions of price changing speeds.
Again, below I have included a screenshot that showing Line charts in my Tradingview account pannel.

Actually, if we want to be successful in Trading, we have to analyze the market from the Japanese Candlestick chart before entering for a trade. Below I have categorized the main reasons behind that.
TO IDENTIFY MAJOR REVERSAL OF THE PRICE
- If we closely look at the price chart of a market, we can see various types of price movement in a chart. So, after the end of an uptrend or the end of a downtrend, we can determine the next trend if we look at the candle pattern.
TO IDENTIFY CORRECT ENTRY TO THE MARKET
- We all know that, if we enter the market at the wrong time, it can be a reason to lose our investment within few hours. So, it is very important to identify the correct entry to the market before buying any crypto or fiat.
TO IDENTIFY SUPPORT AND RESISTANCE IN THE MARKET
- Especially, in a cryptocurrency market, most of the time we can see specific buying or selling patterns in 4hours, Day or Weekly charts. We already know that higher crypto owners trying to manipulate the market. So, we can highlight their buying or selling patterns according to the candlestick charts and we can decide on support and resistance lines in the market. So, it is very helpful to enter or exit from the market at the correct time.

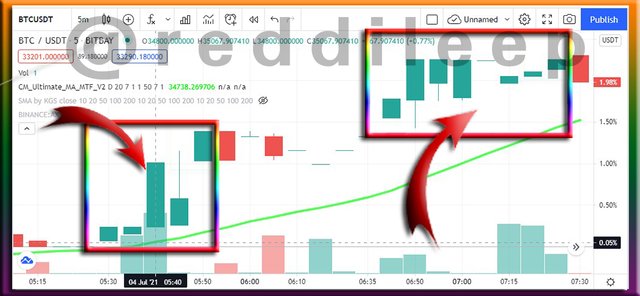
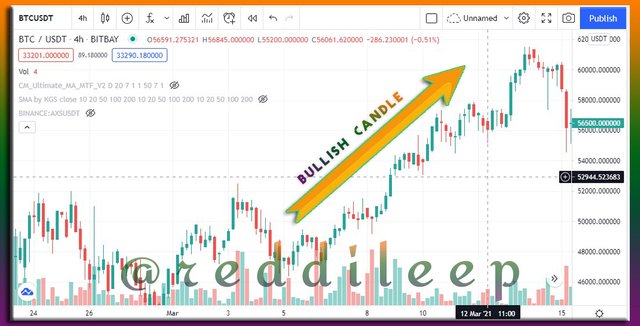
BULLISH CANDLE
- This candle most of the time represent an Uptrend of a Market. It means the price is increasing rapidly. Actually, we know the cryptocurrency market is volatile. So, in this volatile market, we can see a lot of candlestick patterns like green candles and red candles changing from shift to shift. Then, if we see a continuous movement of a price increasing, it can be defined as a bullish candle.
Below I have attached a screenshot of price movement of Bullish candlesticks.
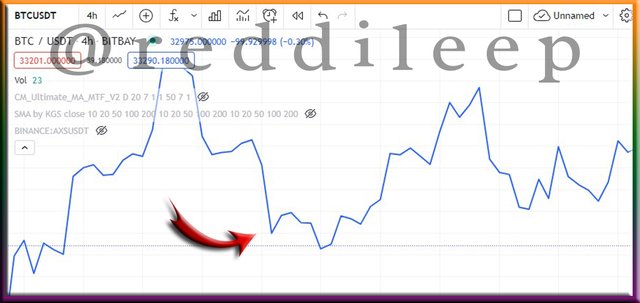
BEARISH CANDLE
Basically, This is the reverse of Bullish Candle. here we can see a Downtrend of a market. It means the price is decreasing rapidly. These candles are relatively very bad for buyers in the market. Because it means the value of their crypto is going to decrease.
Further, these candles occur due to the high selling pressure of the market.
Below I have attached a screenshot of the price movement of Bearish candlesticks.

At present, market analysis is very essential before taking a decision on the market and it helps to increase our cryptocurrencies or Fiats. So, these candlestick charts are very helpful to get an accurate idea for our analysis. We have to understand important candlestick patterns well and we can enter the market at the correct time.
This is all about my homework and I really appreciate Professor @reminiscence01 for your valuable lesson and your dedication to creating a very essential lesson for us. This lesson really important to my life as I am trading in the cryptocurrency market.

Thank you..
Hello @reddileep, I’m glad you participated in the 2nd week of the Beginner’s class at the Steemit Crypto Academy. Your grades in this task are as follows:
Recommendation / Feedback:
Your presentation is superb. Also, you answered every question in a detailed manner. Thank you for participating in this homework task.
Thank you very much for your feedback professor