Steemit Crypto Academy Season 4 Beginner's Course - Task 10: Candlestick Patterns :: For professor @reminiscence01 :: by @ready247
Q;1) Explain the Japanese candlestick chart? (Original screenshot required).
Q;2) In your own words, explain why the Japanese Candlestick chart is the most used in the financial market.
Q;3) Describe a bullish and a bearish candle. Also, explain its anatomy. (Original screenshot required)

Q;1) Explain the Japanese candlestick chart? (Original screenshot required).
The Japanese candlestick, which can also called candlestick chart, is an Old system evolved in the 1700s by Mr, Munehisa Homma, a Japanese rice trader. Which he found became inspired through the feelings of rice traders. Currently used these days in stock analysis, to decide price change and the way the market reacts to this.
The Candlestick is formed from the exchange among buyers and sellers on a specific asset. It is a style of chart used as a graphical illustration of price movement withinside the financial market.
candlestick chart on it own, is a cool useful indicator in cryptocurrency trading system, because it indicates significant price adjustments at every point and future analysis of price change.
Here is a picture of a Japanese candlestick chat
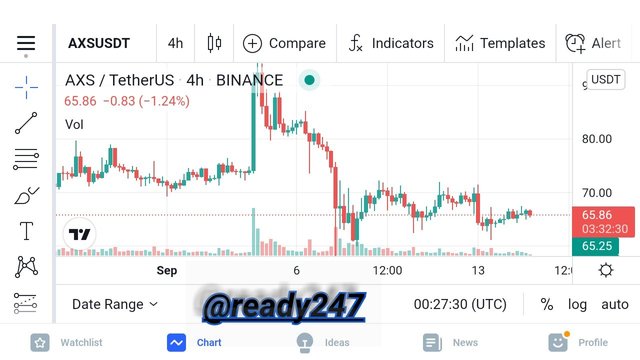
this 👆Screenshot is from trading view app
Q;2) In your own words, explain why the Japanese Candlestick chart is the most used in the financial market.
From my understanding, the main reason why the Japanese candlestick chart is the most used, is that it accurately offers a correct and specific graphical representation of the price change at each point of time. And It indicates numerous price points throughout the interaction among buyers and sellers.
The nice part of the Japanese candlestick chart that it does it work in offering complete information analysis alongside with it digital aid in any cryptocurrency or chart assessment as earlier mentioned.
They shows graphically, with the supply and callfor that may be a determinant in each time price moves,
BULLISH CANDLE
The bullish candle is the gain type of a candlestick pattern which forms in an uptrend signaling a turnabout. This indicates that the buyers have manipulated or taken control of the market price and the sellers has totally lost it, which means that, buyers has over come sellers,
Anatomy
The candlestick contains or consist four distinctive parts, which is Open, Close, High, Low, each of them representing distinct point, during price movement.
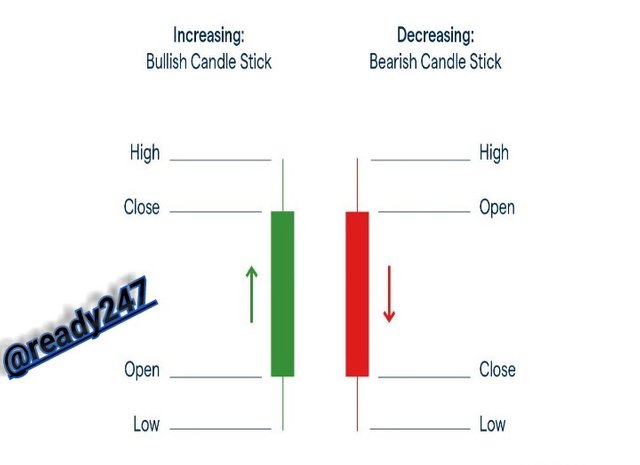
- Open
The opening price normally indicates the start-up price of a given cryptocurrency,
- Close
The closing price is a part that shows the end of the candle within a specified period of time and it indicates the last price recorded.
- High
Highest price is a among the candlesticks which shows the ultimate price recorded within a specific time.
- Low
Low price shows the lowest or smallest price that has been recorded within a specific time.
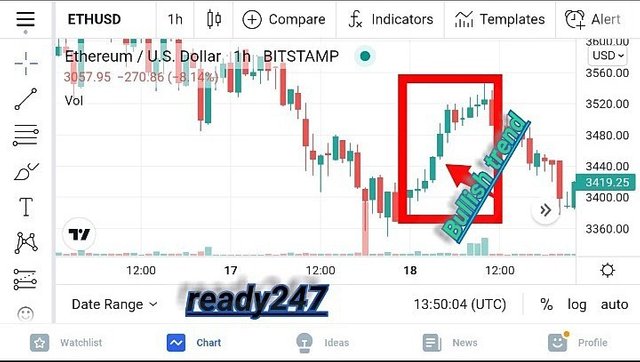
HERE IS AN EXAMPLE OF A BULLISH CANDLE
According to the chart below, it indicates an uptrend movement of ETH/USD at the very moment i made the screenshots,
BEARISH CANDLE
The bearish candle is a swamp candlestick pattern which develops or forms in an downtrend signaling a reversal withinside the contrary direction. And it indicates that sellers have taken full control of the market price and buyers has totally lost it, which means that, sellers has over come buyers,
Anatomy
According to the previous typical anatomy of candlestick pattern, previous candle's
The bearish candle normally opens above the previous candle's,The duration of the bearish swamp the preceding green candle. Bearish candle always closes under the preceding candles opening.
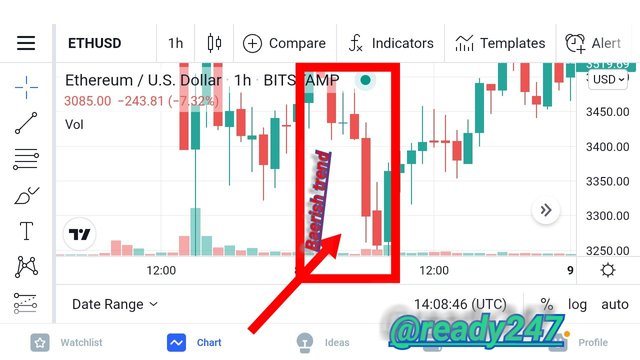
HERE IS AN EXAMPLE OF A BEARISH CANDLE👇
According to the chart below, it indicates an downtred movement of ETH/USD at the very moment i made the screenshots,
CONCLUSION
I have now understood that the Japanese candlestick chart has been in place for a long time now and it has been accessed by all traders with a purpose to run a clean trading and funding period and with the help of the bullish and bearish candle, the full possibility of tracking the market chart conduct are made available,
My greatest thanks to professor @reminiscence01 for this wonderful lecture, i really learnt a lot,