Steemit Crypto Academy Season 5 Beginner's Course - Task 10: Candlestick Patterns
QUESTIONS
Identify these candlestick patterns listed in question 2b on any cryptocurrency pair chart and explain how price reacted after the formation. (Original Screenshot of your chart required for this exercise).
Explain the measures taken by the trader before trading candlestick patterns.
Using a demo account, open a position (buy or sell) on two crypto assets using any candlestick pattern and explain your reason for taking the trade. You can perform this operation using lower time frames. (Show screenshots of your position and also your chart.

IDENTIFY THESE CANDLESTICK PATTERNS LISTED IN QUESTION 2B ON ANY CRYPTOCURRENCY PAIR CHART AND EXPLAIN HOW PRICE REACTED AFTER THE FORMATION. (ORIGINAL SCREENSHOT OF YOUR CHART REQUIRED FOR THIS EXERCISE)
The candle stick patterns listed in 2b are:
Bullish engulfing Candlestick pattern
Doji Candlestick pattern
The Hammer candlestick pattern
The morning and evening Star candlestick pattern.
The Harami Candlestick pattern.
Bullish engulfing Candlestick pattern:
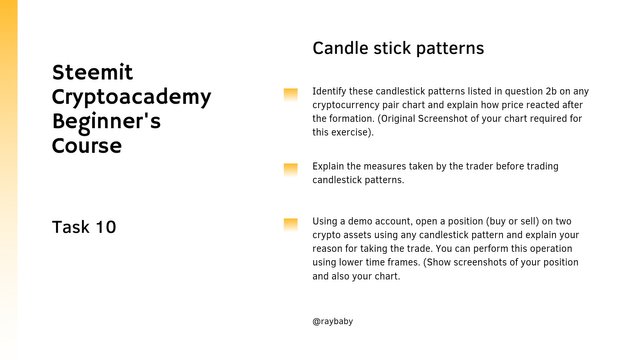
A bullish engulfing candlestick pattern is a two candle stick pattern whereby a small red candle is accompanied by a big green candle that completely covers the body of the previous red candle. A bullish candle pattern is the most commonly used pattern strategy by traders and it is used to find the entry and exit point of a trade.
A red candle basically signals that seller has taken over the market and are more interested in selling, so when a red candle reaches or touches the support area of a trade and a green candle appears that completely engulfs the previous red candle, it means that traders are now interested in buying, thus buyers has temporarily taken over the market. A bullish candle stick pattern, signals that there'd be a temporary increase in the price of the cryptocurrency. It basically used as an entry signal in a trading strategy.
Bullish engulfing candlestick pattern: SOL/USDT chart
Doji Candlestick pattern:
Doji candles are basically wicks that looks like a cross due to the struggling control of the market between buyers and sellers.
A Doji is a candle that shows that the opening price of the market is the same as its closing price.
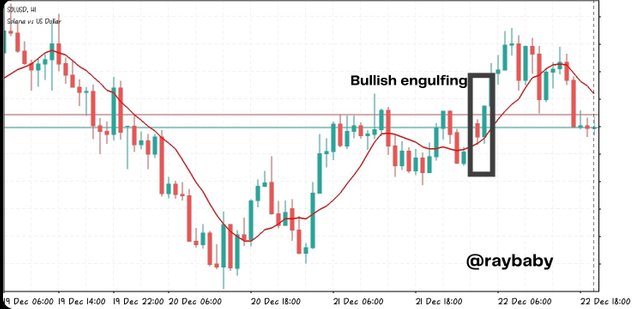
There are different kinds of doji with it's different meanings and they are ; the Common Doji, Gravestone Doji, Dragonfly Doji, and Long-Legged Doji.
The common doji:
In common doji, the opening and closing of a trade is near the middle and it denotes that buyers and sellers are both struggling for dominance in the market.
Long-Legged Doji:
The long-legged Doji candle is similar to that of the ‘common Doji candle’. Though the difference lies in the fact that the long-legged Doji candle has a longer wick than the common doji.
Dragonfly Doji:
Here sellers influences the market by selling, the price of the market goes downward, then buyers begin to influence the market by buying, the price goes back up. Thus there will be a dragonfly pattern at the end of the downtrend.
Gravestone Doji:
This is the opposite of the dragonfly doji, here as buyers influence the market by buying more, the price of the market goes up, then sellers begins to influence by selling the market and the price goes up. Thus, there will be a gravestone pattern that will close at the end of the uptrend.
Doji candle stick patterns: SOL/USDT chart
The Hammer candlestick pattern:
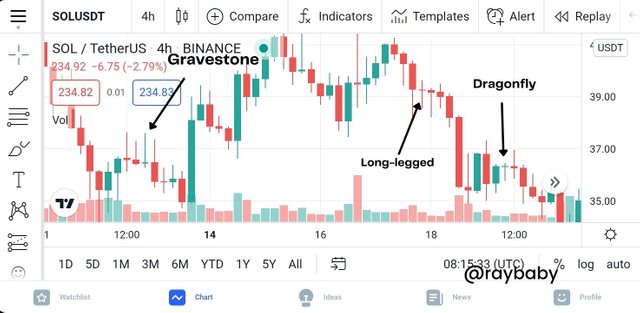
A hammer candle is a basically a candle pattern that has a small real body and a longer lower shadow/wick. For it to be called a hammer candle, the wick must be twice as tall as the body.
A hammer candlestick pattern can be bullish or bearish considering the price decline but a hammer candle stick always signals that the market will take an uptrend.
There are two types of hammer candlestick namely; the inverted hammer and the normal hammer candlesticks.
Hammer candlestick patterns: SOL/USDT chart
The morning and evening Star candlestick pattern
The morning star pattern:
The morning star pattern is a bullish reversal candle pattern, that will occur at the base of a downtrend. It is made up of three candlesticks:
The first candlestick is bearish candle that indicates that sellers are in control of the market.
The second candle is a small candle mostly Doji which can either be a bearish/bullish candle. It shows that sellers are still in control of the market, but buyers have begone reeling their head.
The third candle is a big bullish candlestick. Thus indicating that buyers has taken control of the market.
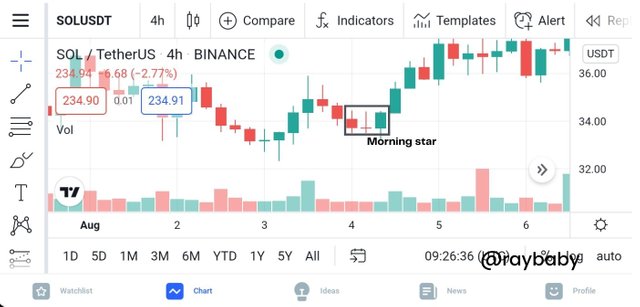
Morningstar candlestick pattern: SOL/USDT chart
The evening star pattern:
In general, the evening star pattern is the opposite of the morning star and it denotes tfat a bearish season will befall the crypto-market. it usually occurs at the top of an uptrend.
The pattern consists of three candlesticks:
The first candle is a bullish candle that indicates that buyers are in control of the market.
The second candle is a small candle mostly Doji which can either be a bearish/bullish candle. It shows that buyers are still in control of the market, but sellers have begone reeling their head.
The third candle is a big bearish candle.Thus indicating that sellers has taken control of the market
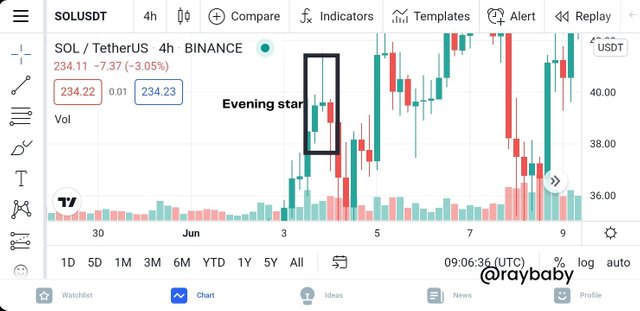
Evening star candlestick pattern: SOL/USDT chart
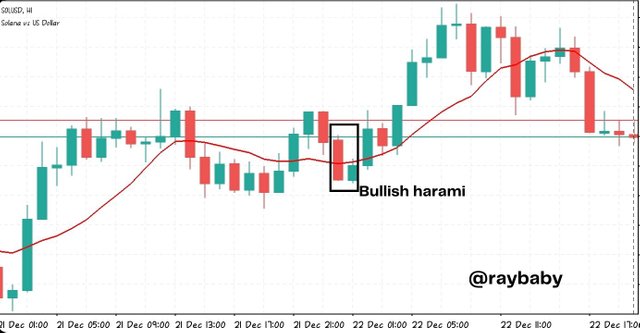
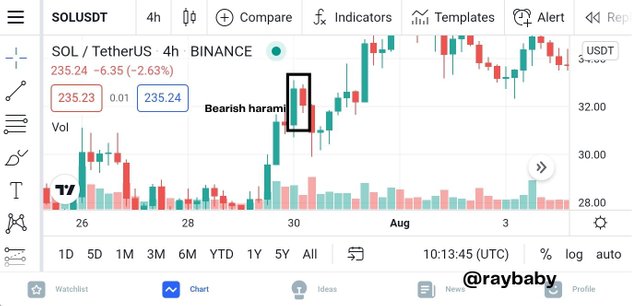
The Harami Candlestick pattern
This candlestick is considered as a either a bearish signal or a bullish signal depending on the location of it's occurrence (top of the uptrend or base of a downtrend).
A harami candlestick pattern ‘means pregnant in Japanese), which consists of two candlesticks:
The first candle is called ‘the mother’ candle and it is a big candle which is followed by a smaller candle called ‘the baby’(a smaller candle)
In a harami candlestick pattern, the second candle has to close
outside the previous candle.
There are two types of harami candlestick; the bullish harami and the bearish harami.
The bullish harami signals uptrend in the market while the bearish harami signals a downtrend in the market.
EXPLAIN THE MEASURES TAKEN BY THE TRADER BEFORE TRADING CANDLESTICK PATTERNS
Intensive learning and studying of technical analysis on candlestick trading. A trader should do well to avoid guesses while trading and should properly study a market before entering it.
Paying keen attention to the trend of a market and not base your entire focus on the candlestick pattern
A trader should know how to draw support and
resistance, and how to draw trend lines. This helps traders know when to enter a market and also when to leave one.Recognize the candle stick- what candlestick is being traded, Doji, shooting star, engulfing bar etc
Realize the information the candlestick is passing through on the market- if the market is uptrend, ranging etc
Relationship between the candle and the stop loss and resistance level of the chart
Use of indicators to validate the candle stick e.g factor of conference or make use of top-down analysis
Allow the candle to close before taking trade.
USING A DEMO ACCOUNT, OPEN A POSITION (BUY OR SELL) ON TWO CRYPTO ASSETS USING ANY CANDLESTICK PATTERN AND EXPLAIN YOUR REASON FOR TAKING THE TRADE. YOU CAN PERFORM THIS OPERATION USING LOWER TIME FRAMES. (SHOW SCREENSHOTS OF YOUR POSITION AND ALSO YOUR CHART
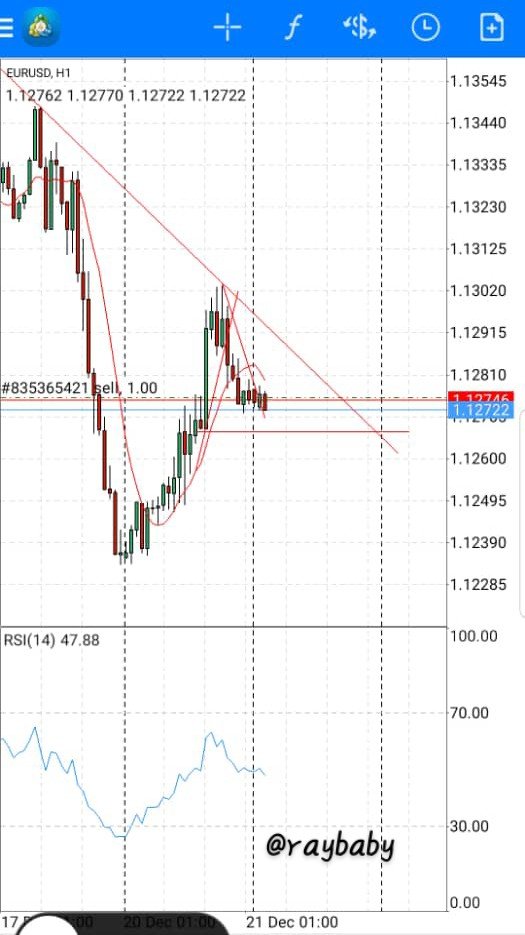
Making use of MT5 (metatrader5) to trade the EUR/USD market, I took my trade.
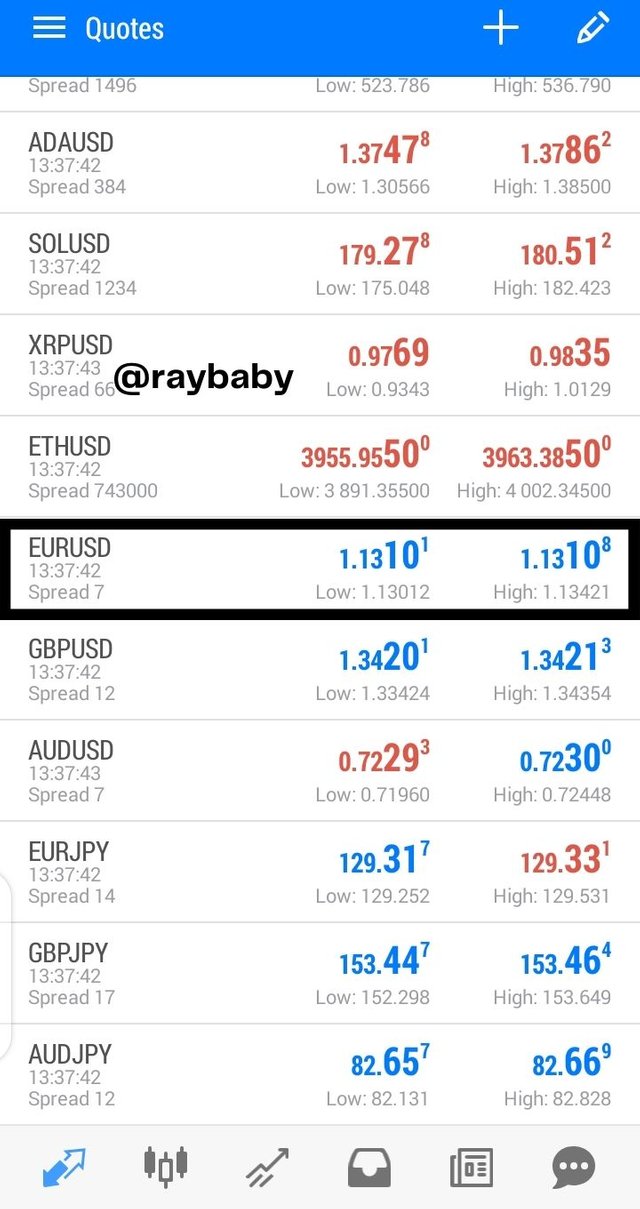
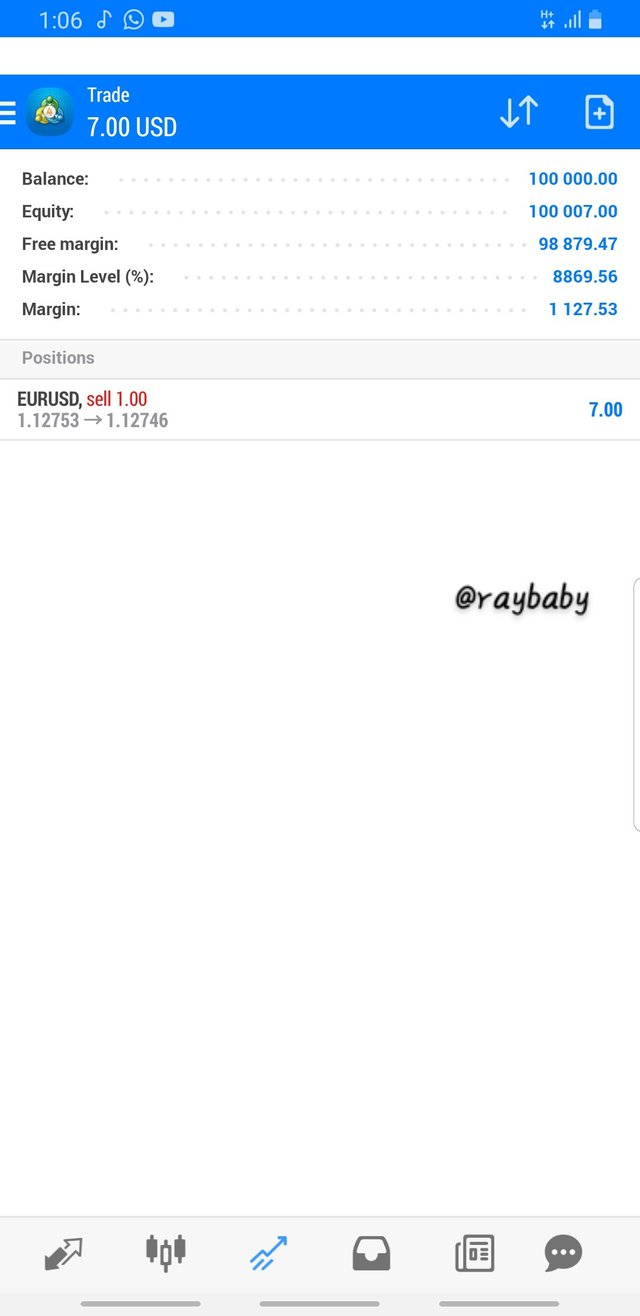
Due to my noticing the presence of a bearish engulfing pattern which from the lesson above denotes that a downtrend will follow suit, I placed a sell trade by trading with the swings of the current market trend which is a downtrend (swing high and swing low) on a hour time frame. I therefore proceeded to opened my trade at 1.12762 and set my take profit (TP) at 1.12722.
On selling, I made a profit of $7 as shown in the image below.
CONCLUSION
I Have had prior knowledge on candlestick patterns and trading with MT5 but with the aid of this course I have been able to do a little reading and refresh my mind on candlestick patterns.
Thank you for reading:
Professors;
@reminiscence01
@dilchamo