Crypto Academy Week 14 - Homework Post for @kouba01
What is the MACD indicator simply?
Moving Average Convergence Divergence (MACD) Is simply an indicator of oscillators employed by traders to measure the direction and strength of a trend of an asset in the market. It also allows traders to know when the price of an asset is reversed for potential entry and exit positions. Since the late 1970's it has been used by traders to calculate a bearish or bullish trend. This tool has three 3 different components :
The MACD line which differentiates a 12 day EMA and a 26 day EMA.
The signal line calculated from a 9 day EMA of a MACD line
The histogram which shows the relationship between the signal and MACD line displaying green and red lines. when the histogram is at zero it means there is an intersection between the signal and MACD line.
.png)
Is the MACD Indicator Good for Trading Cryptocurrencies?
When trading in the crypto market you need to be able to predict a bearish or bullish trend, the MACD indictor is the right tool for this because it is able to tell the asset price and gives traders good trading signals.
Which is better, MACD or RSI?
We discussed the RSI indicator and how it is used to suggest the rise and fall in prices in last week's lecture. I would prefer the MACD over the RSI indicator, here are my reasons;
The MACD is able to determine the average movement of signals while the RSI detects oversold or overbought signals
MACD provides traders with different features like the histogram, so doing they are able to make the right decisions when trading.
How to add the MACD indicator to the chart
Adding MACD indicator is a very simple task, follow the steps bellow:
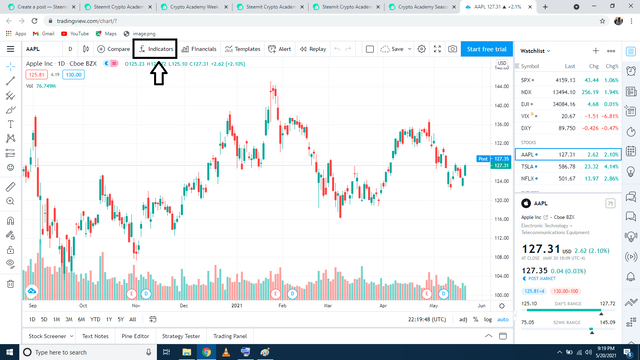
click on indicator at the top of the windown
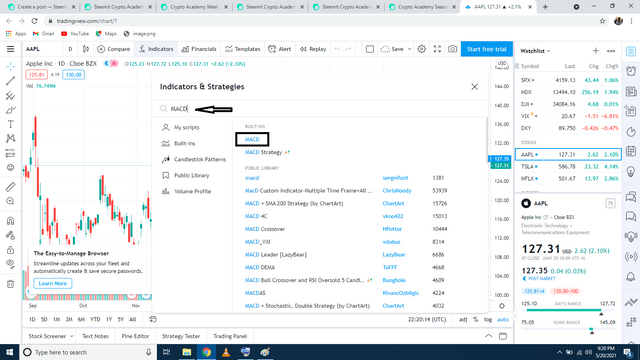
search and add MACD indicator
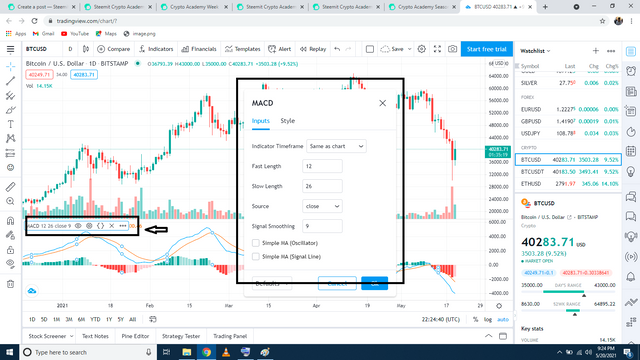
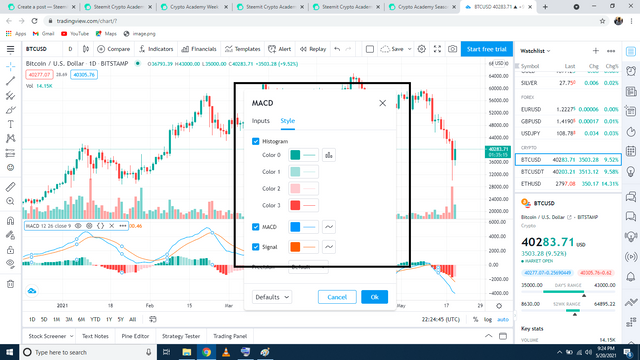
The settings can be found at the bottom left of your window. When you click on setting from the horizontal bar a box opens up showing MACD setting: The Input and style setting
ways to benefit from them
The inputs is used to calculate for MACD and the style determines the appearance MACD indicator, you can change the color of the histogram and signal line. the signal line shows the direction of a trend.
How to use MACD with crossing MACD line and signal line
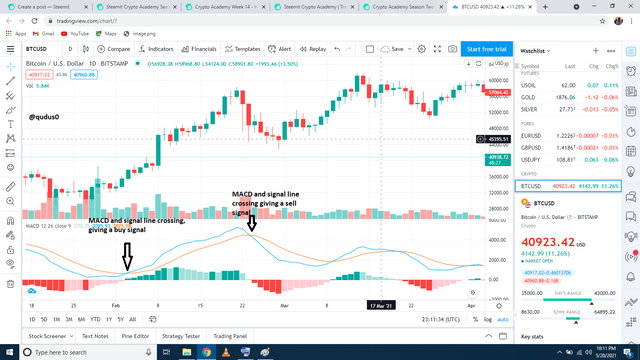
When the MACD line crosses the signal line in and continue in an uptrend it's a good time to buy that asset and when the MACD line crosses the signal line then continue in a downtrend it gives off a sell signal.
How to use the MACD with the crossing of the zero line
It becomes a zero line where the histogram and the MACD line crosses. When MACD line crosses the histogram upwards is a sell signal and when it crosses downwards is shows a buy signal.
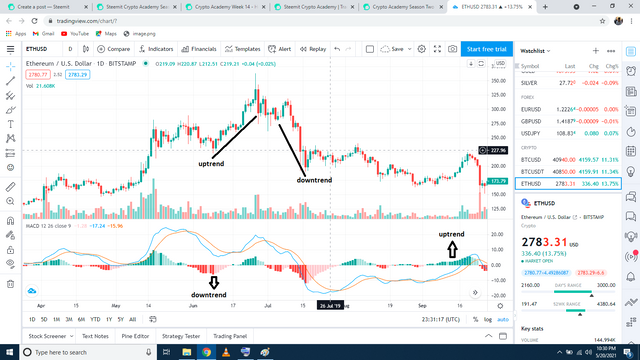
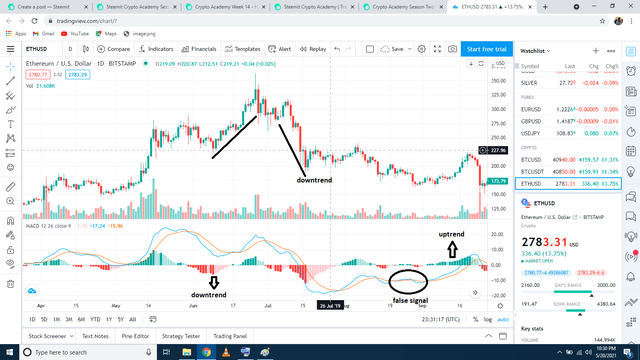
How to detect a trend using the MACD And how to filter out false signals
MACD can be used to determine trends using histogram charts, you can make right decisions by predicting reversals. MACD sometimes give false signals, to filter out these signals using other indications like the tiny candle sticks , whenever you observe these tiny candles act carefully to ensure you make the right decisiond.
How can the MACD indicator be used to extract points or support and resistance levels on the chart
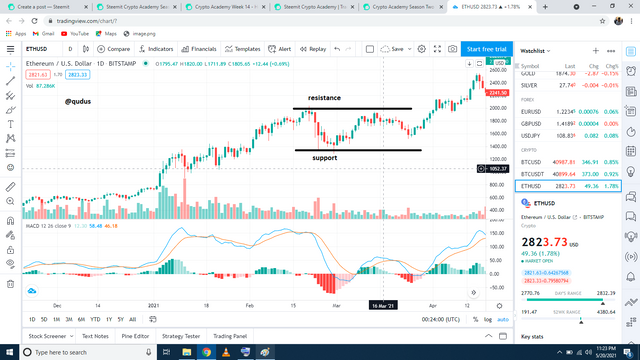
When prices start to rise again after dipping is the support in the market and resistance is the exact opposit of support i.e when prices stop rising and begin to fall. support and resistance are very important to investors and traders who would want to make a lot of profits
Review of the various signals from the MACD
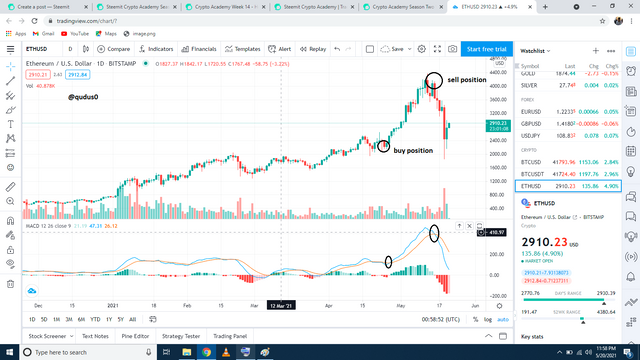
I am reviewing ETH/USD chart showing the MACD indicator signals. As seen from the graph the labelled point sell is the perfect position for traders to sell their assets and the point labelled buy is a good position to buy any crypto asset.
CC : @kouba01
Hello @qudus0,
Thank you for participating in the 6th Week Crypto Course in its second season and for your efforts to complete the suggested tasks, you deserve a 3/10 rating, according to the following scale:
My review :
Your answers to the questions were short and often lacking analysis, and there is no methodology for writing. Where the article appears on the titles and a glimpse of the proposed idea. Try to take your time searching and writing until you achieve what is needed.
Thanks again for your effort, and we look forward to reading your next work.
Sincerely,@kouba01