Basic Trading Strategy using the Harmonic AB = CD + Fibonacci Pattern - Homework Post for [@lenonmc21] by @pushpika
In a every marketing, the main objective of the traders is Gaining Profit So the same would be applicable into crypto market/ crypto trading also.
A market is totally behaved on the basis of trading which means the actions of buyers and sellers. In order to gain the profit, the traders should have a good knowledge of market behavior. We can’t predict the price movements at glance by looking at the market graphs. So it has to be analyzed the present market behavior to predict the future behavior.
There are 3 analysis types to predict the future price movement.
- Technical Analysis : Based on the technical evaluation
- Fundamental Analysis : Based on economic data and news
- Sentiment Analysis : Based on trader’s feeling

Harmonic Trading
Harmonic trading is under Technical Analysis. Most of the price movements are following some different pattern which helps to predict the future movements.
Normally the word “harmonic” represent a meaning of repeating, repetitively occurrence. As the word is meant, the harmonic patterns are pre identified/ pre defined patterns in the trading charts which occur naturally and repetitively based on geometric price action and Fibonacci levels.
These harmonic patterns are trend reversal pattern which helps traders to identify a trend reversal prior to it happens, by identifying the harmonic pattern in the financial chart. If there is a bullish harmonic pattern then trader can identify the starting of bearish trend and vice versa in order to place an order.
In general, there are 5 harmonic patterns and 4 point harmonic pattern. Those points are simply named as X,A,B,C & D and A,B,C,D respectively. Also there are several types of harmonic patterns.
Screenshots from binance.com
Screenshots from binance.com
- ABCD Pattern (4 points)
- Butterfly Pattern (5 points)
- The Gartley pattern (5 points)
- The Bat Pattern (5 points)
- The Crab Pattern (5 points)
- The Cypher Pattern (5 points)
- The Shark Pattern (5 points)
AB=CD Pattern and it's identification
AB=CD pattern is a harmonic pattern which consist of 4 points. As I mentioned earlier in this article, this is a reversal pattern which helps traders to predict the future price movement. The pattern is consist of 3 legs, AB,BC & CD.
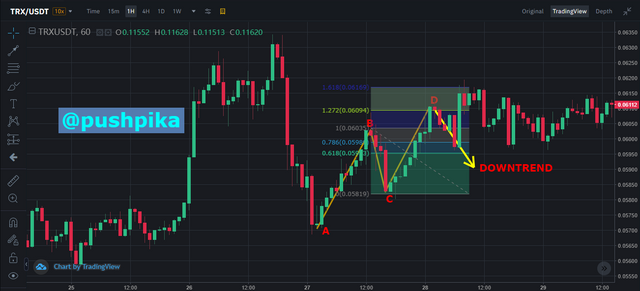
If uptrend AB=CD pattern is identified then downtrend after point D can be expected.
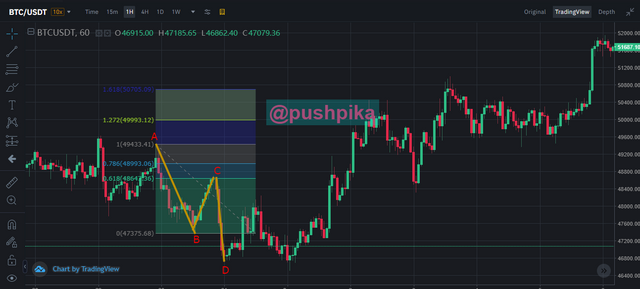
If downtrend AB=CD pattern is identified then uptrend after point D can be expected.
The bullish and bearish AB=CD patterns have the following characteristics that can be used to identify them.
✱ AB line is almost parallel to CD line.
✱ AB line is almost same in length with CD line.
✱ When considering the price movement between A&B, no any price movement shall exceed the price levels of A & B.
✱ The price value of Point C shall be in between the price values of points A & B.
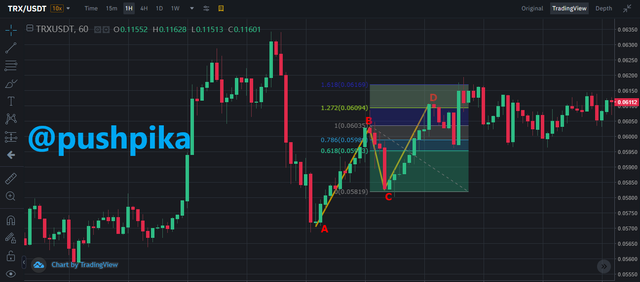
✱ When we draw a Fibonacci retracement from A to B (AB), Point C shall be in between the 61.8% and 78.6% of the Fibonacci Retracements.
✱ When we draw a Fibonacci retracement from B to C (BC), Point D shall be in between the 127.2% and 161.8% of the Fibonacci Retracements.
✱ If above characteristics are satisfied then we can expect a reversal.
The above mentioned characteristics are applicable for both Bullish to Bearish reversal and Bearish to Bullish reversal.
The entry and exit criteria for both buying and selling using the AB = CD pattern?
As a trader, we should have a tactical knowledge to decide the trade opening and closing. So the trader has to do a technical analysis before entering into buying or selling.
Entry Order
When considering AB=CD pattern, the trader should have clearly identified the pattern with above mention characteristics. That means A,B,C & D points shall be well identified as they meet the all the requirements mentioned above.
✱ If A,B,C,D is in a bullish trend (Uptrend), and the trader found that D is between 127.2% and 161.8% of the Fibonacci Retracements, then he has to wait until a bear candle gets appeared. Once it gets appeared, he shall place a sell order.
✱ If A,B,C,D is in bearish trend (Downtrend), ), and the trader found that D is between 127.2% and 161.8% of the Fibonacci Retracements, then he has to wait until a bull candle gets appeared. Once it gets appeared, he shall place a buy order.
Exit Order
As a newcomers, traders shall not take a risk in expecting higher profits. Because only technical analysis will not be sufficient for a expected price movement. It can be suddenly turned upside down with some powerful economical news. Therefore it is better to keep 2% profit margin for all trades.
When placing buy or sell order, we have to set limits for take profits and stop limits. Let’s the trader buy a crypto at 100 USDT. Then he shall set the take profit to 102 USDT and stop loss to 98 USDT.
Make 2 entries (Up and Down) on any cryptocurrency pair using the AB = CD pattern confirming it with Fibonacci.
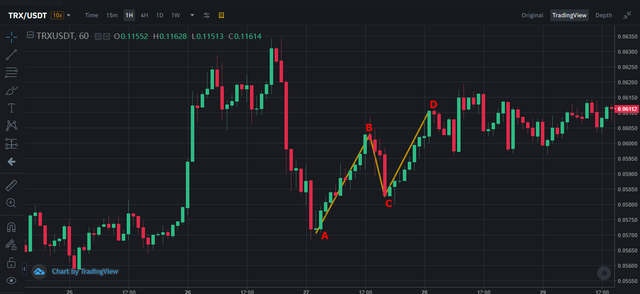
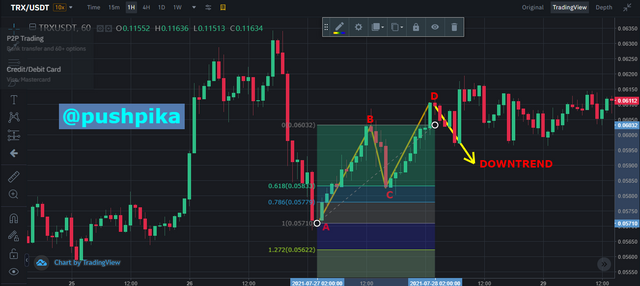
Reversal from bullish to bearish
The analysis has been done for TRX/USDT in 1 hour chart.
Screenshots from binance.com
Screenshots from binance.com
Screenshots from binance.com
Screenshots from binance.com
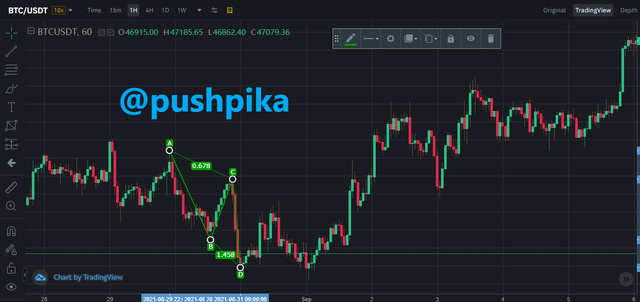
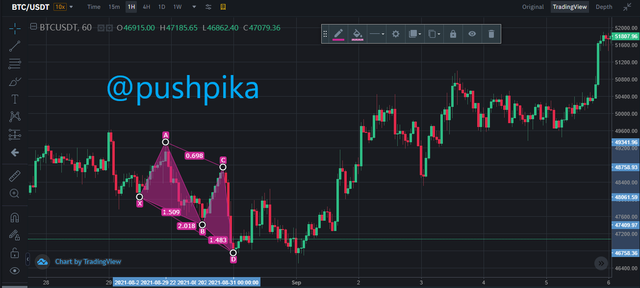
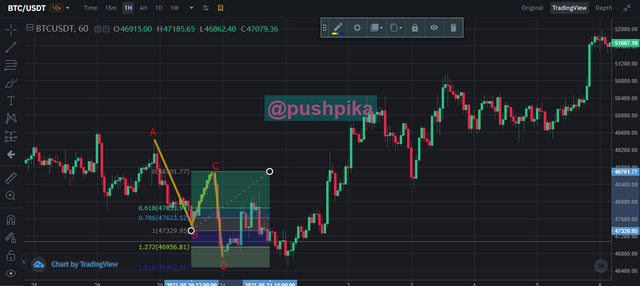
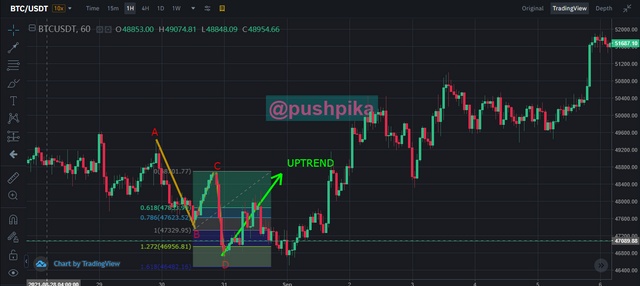
Reversal from bearish to bullish
The analysis has been done for BTC/USDT in 1 hour chart.
Screenshots from binance.com
Screenshots from binance.com
Screenshots from binance.com
There are so many patterns to be studied in Harmonic patterns. Thank you professor @lenonmc21 for your great explanation on the trading pattern. It helps me to lot for my studying on trading.