Crypto Academy / Season 3 / Week 8 - Homework Post for [@asaj]: Crypto Assets and the Random Index (KDJ) / by @preye2
Hello All,


When scalping, the aim of every trader is to make profits regardless of the market direction. Likewise in the crypto market, the most important aspect for traders is looking for possible ways to take profits. So below I will be writing on a technical indicator (KDJ) that can help a trader to detect overbought and oversold as well as a buy or sell signal.
Definition of Random Index (KDJ)
This is essentially the stochastic oscillator with an extra J-line in the indicator to determine overbought and oversold.
The J-line measures the convergence and divergence of the K and D lines, which helps traders to identify the convergence of a particular trend, as well as the rate of change in overbought and oversold.
Explanation on how the KDJ Indicator is Calculated
As we have come to know, we can use the KDJ Indicator to determine trend strength. Traders usually sets their overbought level at 80%, while the oversold is at 20%.
So when the K-line is above the D-line, the J-line will be showing a bullish momentum, likewise when the K-line is below the D-line, the J-line will be showing a bearish momentum.
The J-line shows the difference between the K and D lines, so when the J-line is above both the K and D lines it's showing very strong bullish momentum, and if it crosses below both the the K and D lines it's showing very strong bearish momentum.
The stochastic indicator is between 0 and 100, but the KDJ can go outside this range. So mathematically, KDJ is somehow calculated like stochastic indicator, aside the J-line which stochastic does not have.
- %K = C-L(pk)/H(pk)-L(pk)*100%
where (pk) refers to the first period that was set via the stochastic method. - %D = MA(%K,p3)
where (p3) refers to the third period that is set via the stochastic method. - %J = (3%D) - (2%K).

NUMBER 2
Is the random index (KDJ) reliable? Explain
Before I answer this question I want us to know that the crypto market can sometimes be unpredictable due to the fact that the market undergoes various up and down trends every second, and so there's yet to be an indicator that is 100% reliable.
I can not say that the KDJ indicator is not reliable, but the KDJ indicator is not completely reliable, because it won't really give you any information as to whether it's gonna break out or up, but if you are managing your positions correctly, you can easily buy an asset, increase it's value and sell it quickly for profits.
The KDJ indicator can give you an insight of what might happen next, I mean it can help you identify the rate of changes at a glance, because that extra J-line makes it obvious as to where the stochastic oscillator is going.
Nevertheless, the KDJ signals won't work when the market is not volatile, or when the market trend is neither rising nor falling.
How the random index (KDJ) is added to a chart
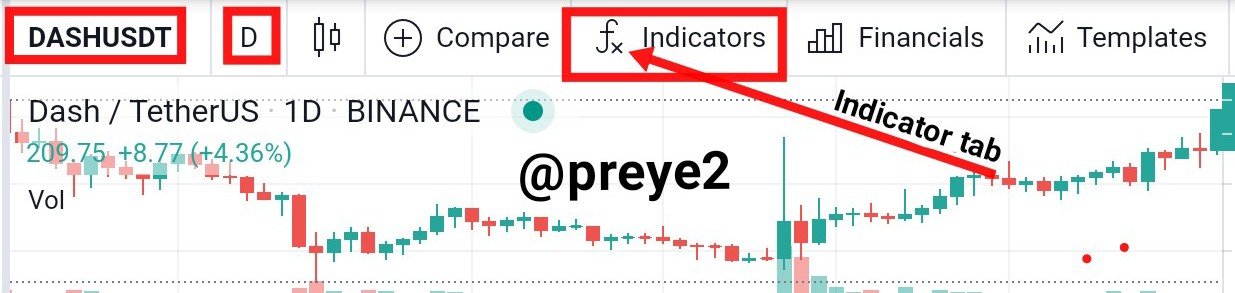
To add the KDJ Indicator to my chart in the tradingview site, I took the following steps:
- I selected the
DASH/USDTpair with a 1 day timeframe - To add the random index (KDJ), I clicked on the "Indicator tab"
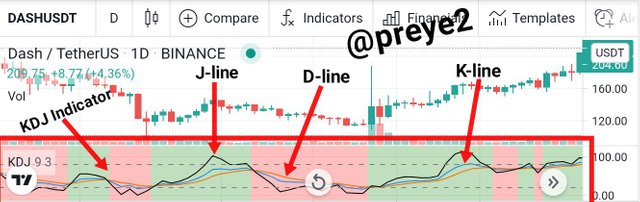
- In the search bar, I typed and selected the first "KDJ", by ll21LAMBOS21

- And Boom! KDJ was successfully added to my chart.

How to modify the KDJ indicator in my chart
To configure the KDJ indicator, I tapped on it, and clicked on the setting icon
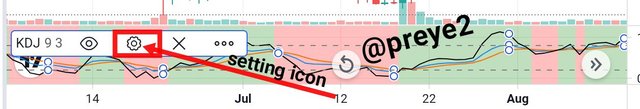
I left the period and signal at 9 and 3 respectively, and I changed the K and D line's colour to green and red, while the J-line is black.


- I left the overbought level at 80%, while the oversold level was at 20%.

Differences between KDJ, ADX, and ATR
The Random Index (KDJ)
The KDJ indicator works like the stochastic oscillator as well as the RSI, which uses the extra J-line to show overbought and oversold conditions.
This is a leading indicator that is made up of three lines (K, D, and J lines), that can be used to detect overbought and oversold. Unlike some other indicators, it can give a trader insight of what might happen next.The Average Additional Movement (ADX)
Is an indicator that majorly measures the strength of trends. It is an oscillating indicator, displayed as a single line, and ranging from 0-100. It only indicates the strength of the trend, and doesn't distinguish between uptrends and downtrends. So basically, the movement of the ADX line is used to indicate trend strength.The Average True Range (ATR)
The ATR indicator is used to set the the stop loss properly. this indicator is made up of one line, and as the name implies, it will show the true value of a stock or crypto pair on a chart. The ATR line is like a moving average, and it follows the price above and below the candles to help traders in trailing stop losses.
Using the Random Index Indicator (KDJ) to Buy and Sell
After conducting my technical analysis on the random index (KDJ) indicator, I will be buying and selling two different cryptocurrencies using the KDJ signals on my Meta Trader 5 (MT5) demo account.
The First chart is a BTCUSD pair chart, with a 5 minutes timeframe

As you can see in the screenshot above, the J-line (black) has just crossed up above the K and D line, and this indicates a buy signal. So I placed a buy order on the BTCUSD pair. And as you can see below I have placed the order.

The Second chart is a DASHUSD pair chart, with a 2 hours timeframe

As you can see in the screenshot above, the J-line (black) has just crossed down below the K and D line, and this indicates a sell signal. So I placed a sell order on the DASHUSD pair. And as you can see below I have placed the order.

Conclusion
KDJ is really a unique indicator, which uses it's J-line to detect overbought and oversold. This indicator is now one of my favourite indicator because it is reliable in identifying the strength of a trend, that is when the J-line crosses over the 80 or 20 percent.
The KDJ signals won't work in a market that is not volatile. This indicator can easily be added to any chart.
This indicator will go a long way in helping investors make either quick or llong-term profits.
So am grateful to professor @asaj for bringing this topic to us this week.
Superb performance @preye2!
Thanks for performing the above task in the eighth week of Steemit Crypto Academy Season 3. The time and effort put into this work is appreciated. Hence, you have scored 8 out of 10. Here are the details:
Remarks
You have displayed a good understanding of the topic Preye Godgift. You have completed the assigned task. Your answer to the third task most especially stood out, which provided the configuration parameters of the KDJ indicator.
Thanks for your remark and guidance respected Prof. @asaj, I really appreciate your hardwork