Crypto Academy / Season 3 / Week 7 - Homework Post for Professor @yousafharoonkhan / on How to create an account on TradingView, how to use indicators, tools, features of tradingview / by @preye2
Hello All,

What is Tradingview Site?
Tradingview is one of the best crypto charting site that helps crypto and stock traders to technically analysis the crypto market. This site consist of various tools and indicators which enables investors to efficiently analyzed the market.
It provides free version for new investors, except if you want to try the Pro versions. So below, I will be following these steps to register a free account in tradingview.
How to register an account on tradingview
First things first, I search for the tradingview website on my Google search engine Tradingview Site, I saw various plans but I clicked on the free basic for a start.
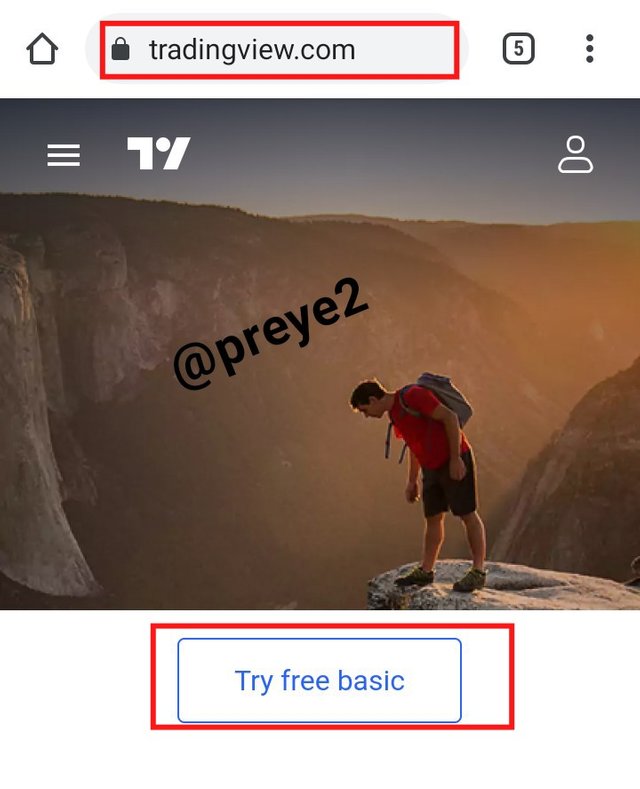
After seeing the various means of registration, I choosed to use my Email for the sign up.

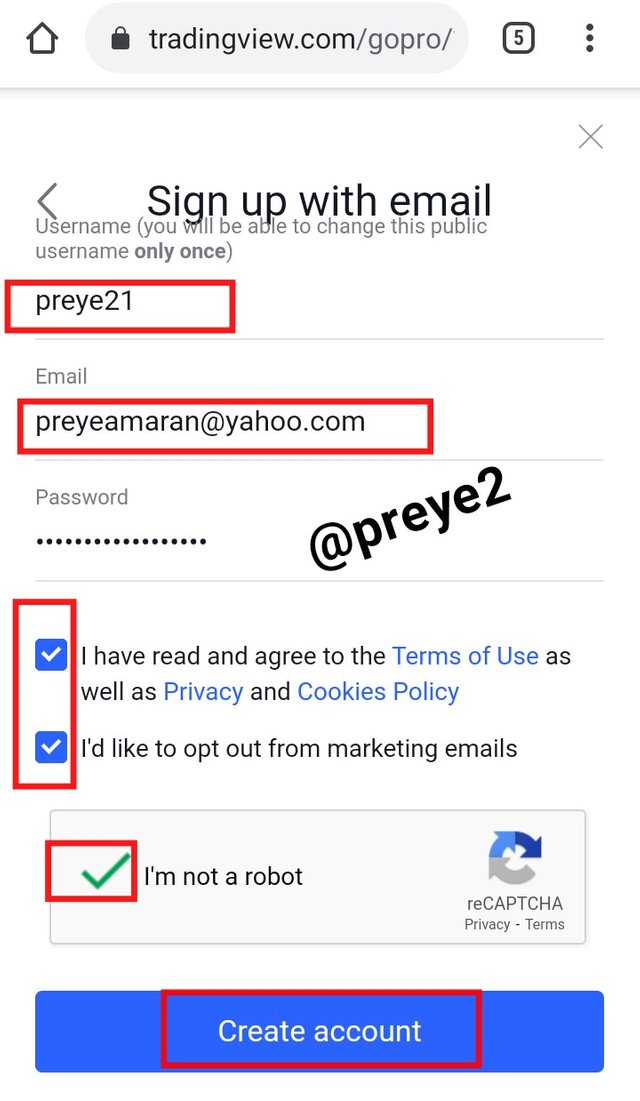
I was requested to insert my username, email, preferred password, as well as clicking on the Captcha that will Indicate that I am not a robot,
After inserting what was necessary, I clicked Create account.
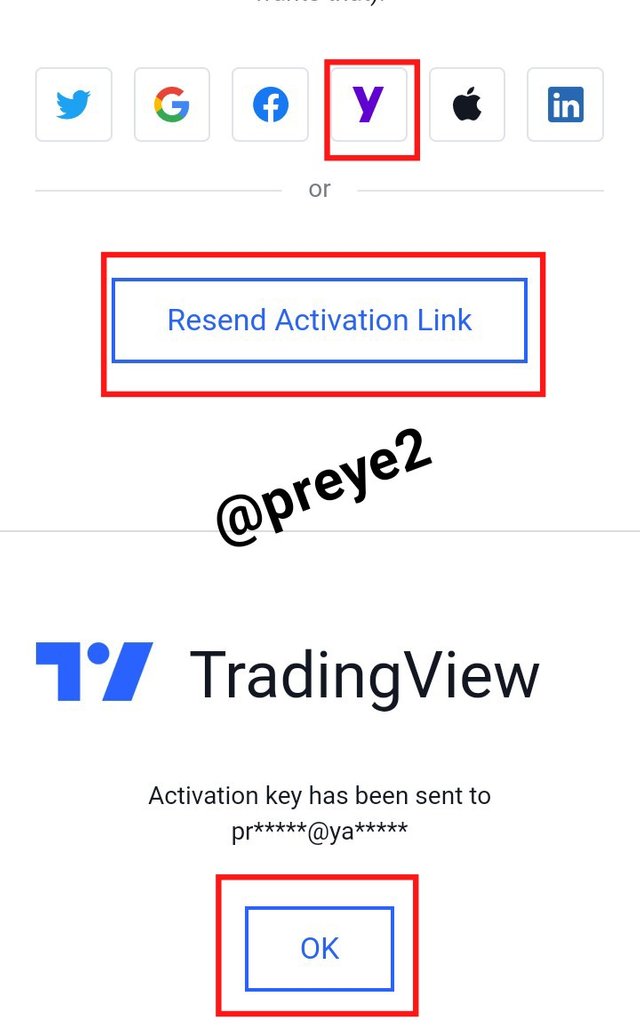
To activate my account, I will need to click on the link that has been sent to my email address,
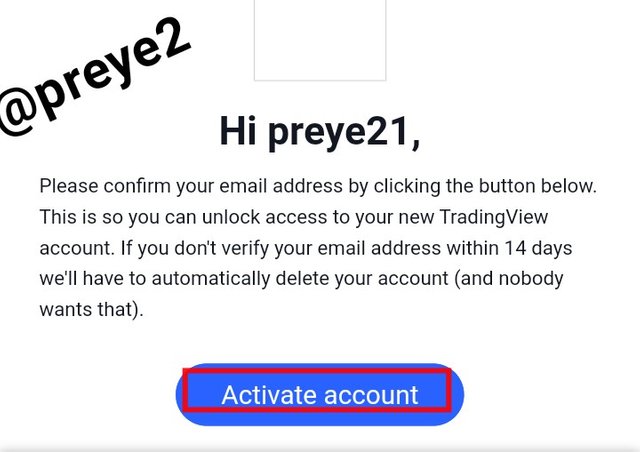
I clicked on the "activate account" tab sent to my email address,
And finally I attached my picture, as well as names, and clicked on the Continue tab.
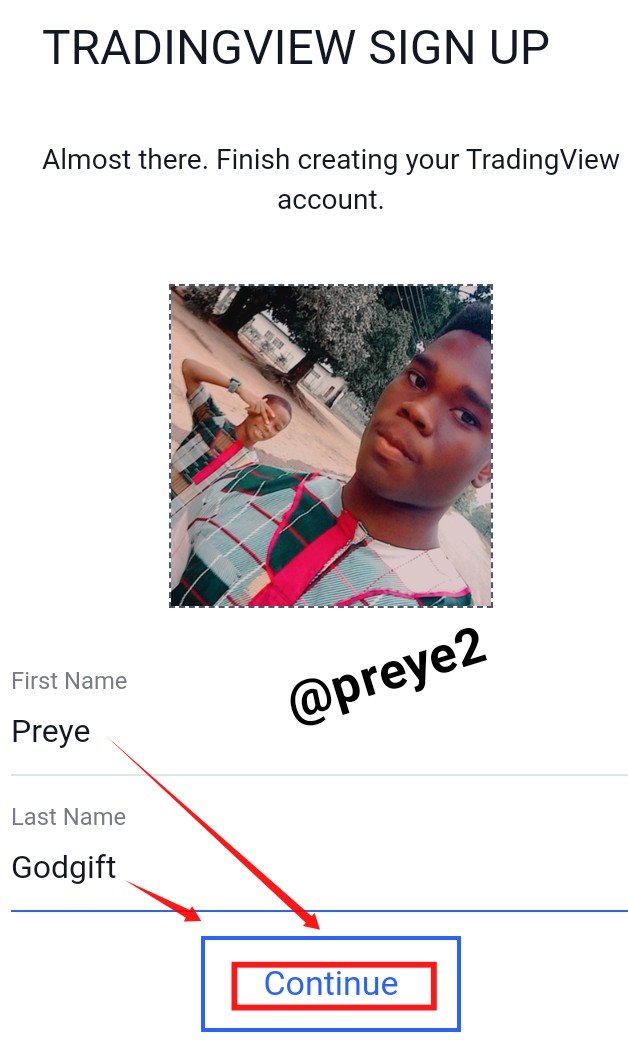
My free basic registration process was completed, but during the process of choosing a plan, I saw various different registration plans. Below are the registration plans I saw.
Tradingview Different Registration Plans
Besides the Basic Plan which is not only free but good enough to perform alot of task on the platform, there are 3 different plans in tradingview.
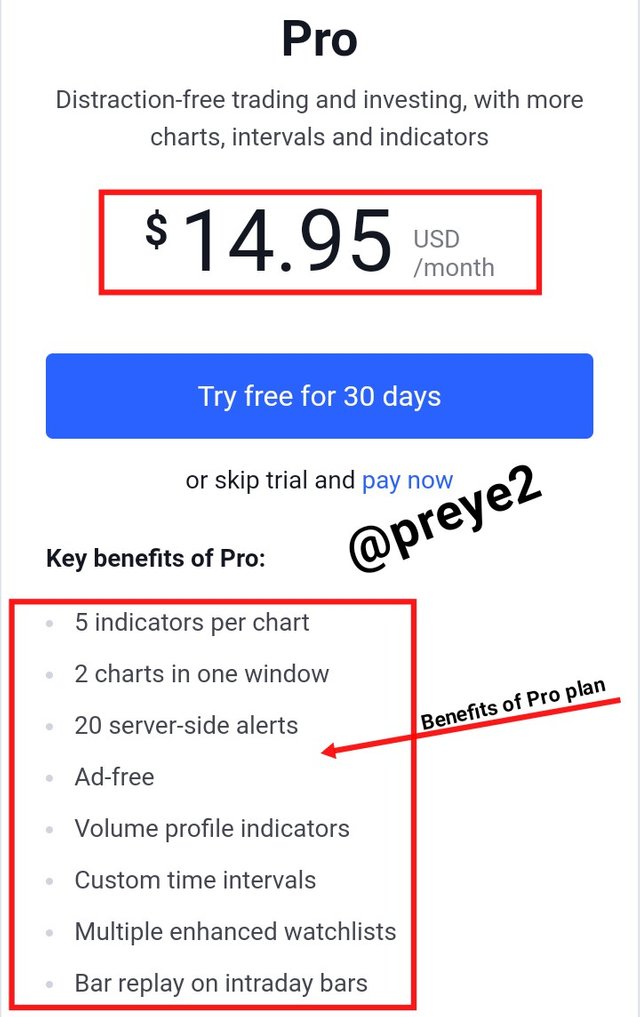
This plan can be purchased with $14.95 per month, and it has more packages than the free basic plan. what I like more about the Pro plan is that it's Ad-free.
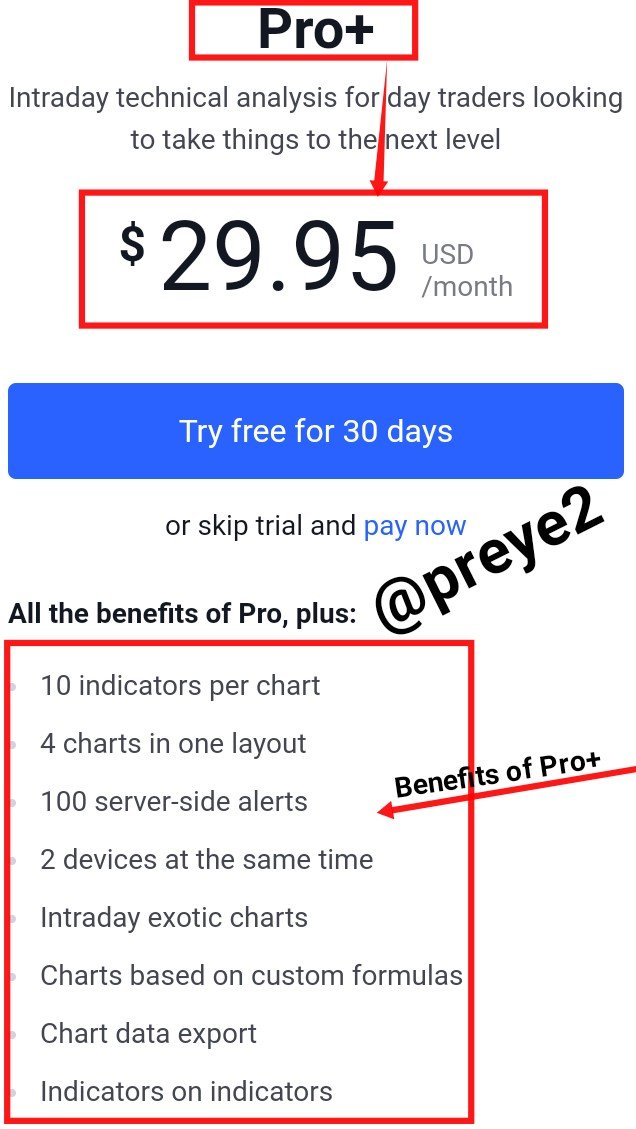
This plan can be purchased with $29.95 per month, and it has more packages than both the Pro plan and the free basic plan.
This plan can be purchased with $59.95 per month, and it has the complete packages.
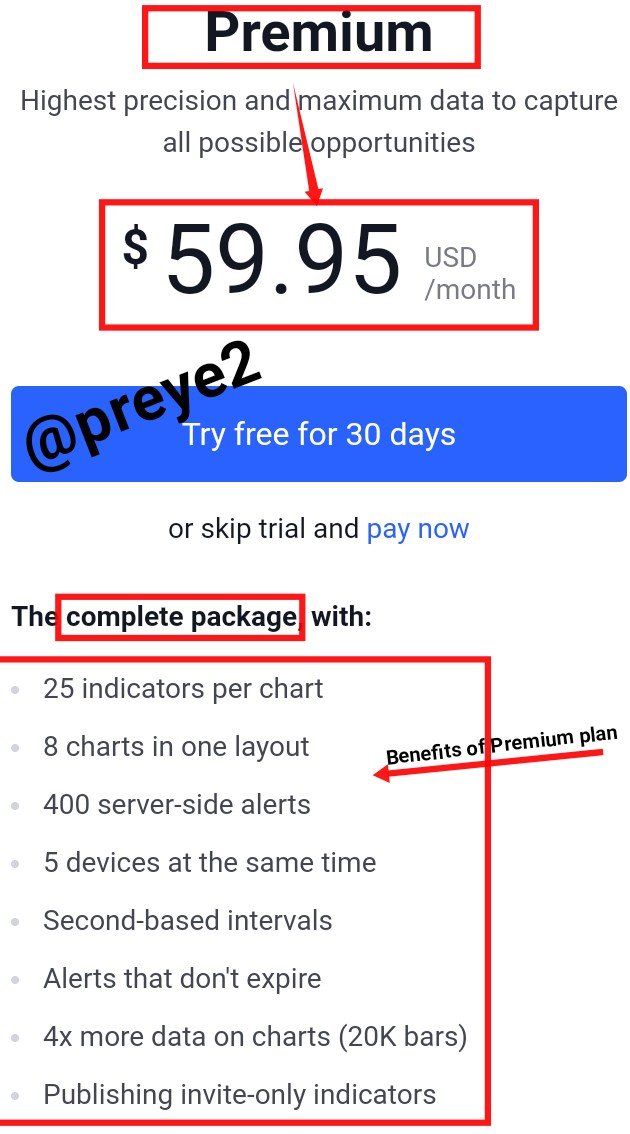

The Various Features of Tradingview
Some of the various features of tradingview includes:
Charts: It allows traders to create different types of charts to help track how the market is going.
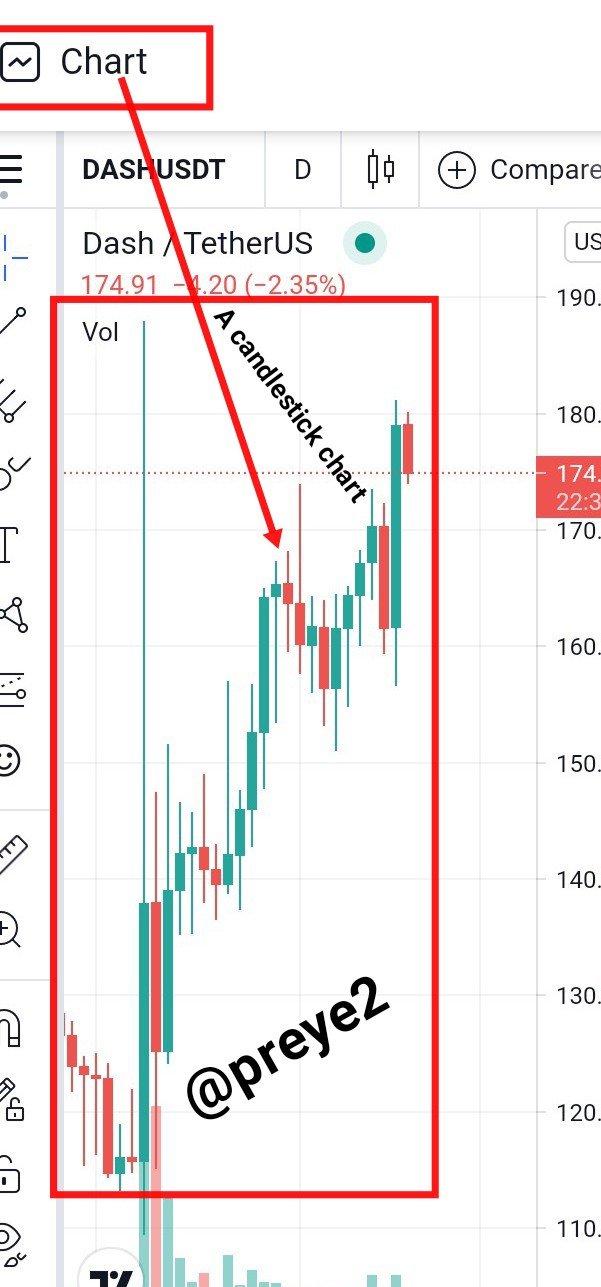
Over a 100 pre-built Indicators
Over 50 drawing tools
Multiple timeframe analysis

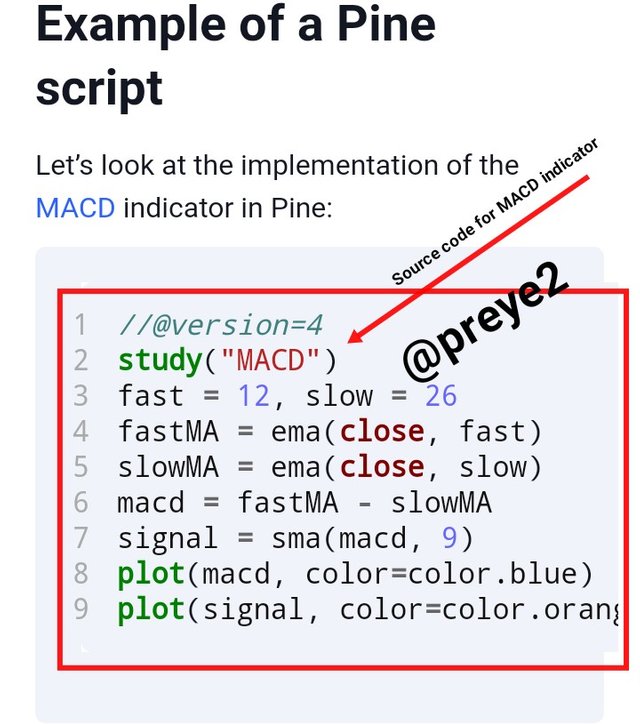
Pine Script: This is useful to most computer programmers out there, because it allows a person to write and share his/her own technical analysis Indicator and strategies.
Powerful Alerts: This will help a trader not to miss a trade.
Largest social network online for traders: This allows investors to share and explore their own trade ideas, as well as chatting with other traders online
Global Market Accessibility: It is linked to many data feeds with access to commodities, stocks, forex, indicies, as well as crypto.
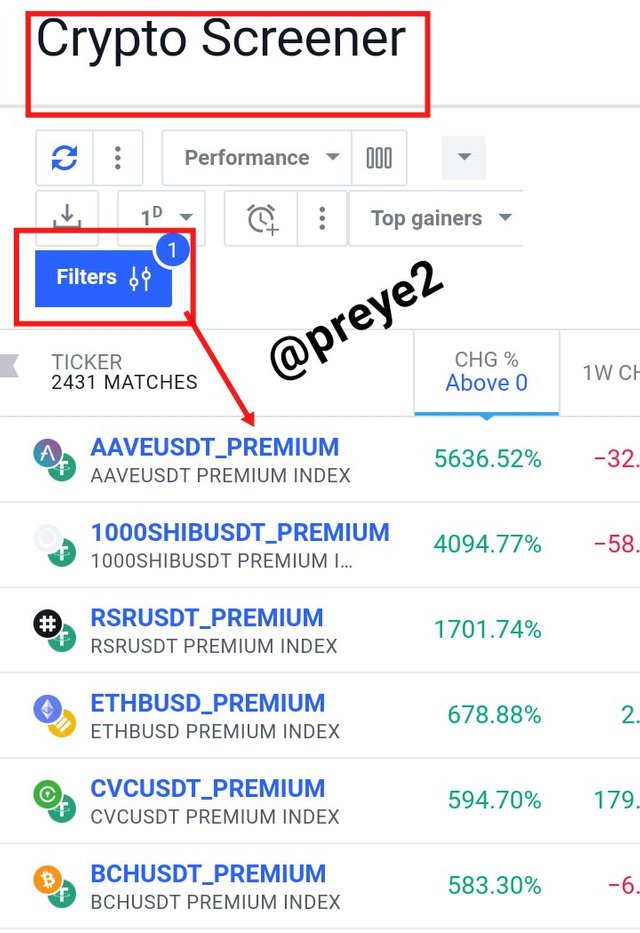
Flexible Screeners: This allows you to filter assets that will help you find assets with possible trading opportunities.
My Favorite Tradingview Feature With Reason
My most preferred feature in tradingview is the Alert feature. This alert feature is very important to investors, because it notifies you when the market gets to your desired level. Traders can easily create this alerts on prices, as well as drawing tools.
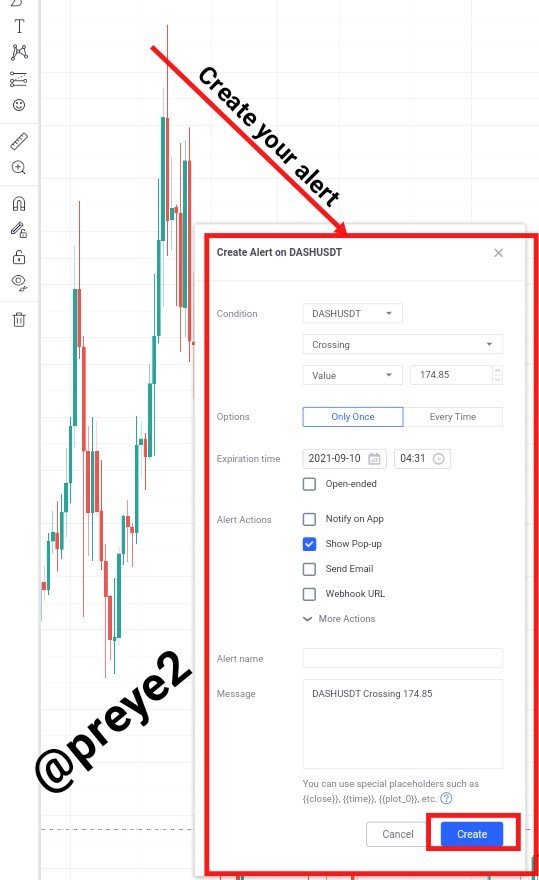
This feature will go a long way in helping investors not to miss out on trades.
This alerts can be in various forms like sms, email, audio signals etc.

Setting up a chart in tradingview
This is a way by which traders can easily add or apply various changes to their charts.
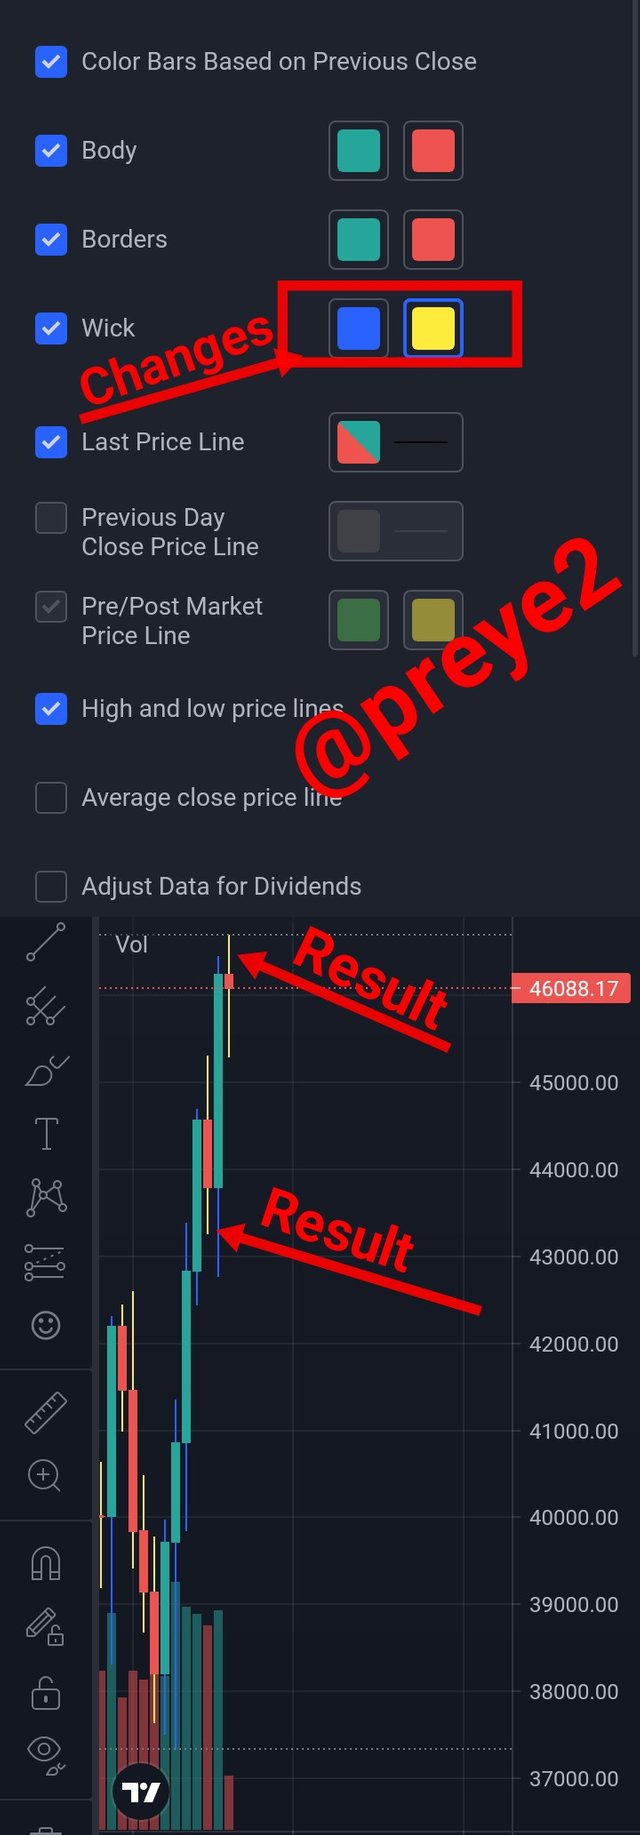
I first clicked on the setting icon at the top right hand side of my screen,
And I would be able to make any changes in the body, borders, wick, and so many other parts of our chart.

For example I want to change the wick of my chart from green and red to blue and yellow respectively.
Using tools to edit charts in tradingview
This is a way by which traders can easily use the various tools to add or remove (edit) things in the chart. It is located at the left hand side of our screens.
Below are two examples of tools used to edit charts
1. Ruler-like Tool: I suggested that name because the tool is like a measuring ruler. It is actually used to detect the number of bars or candlesticks in the chart. Below is a BTC/USDT pair with a 1 day timeframe.
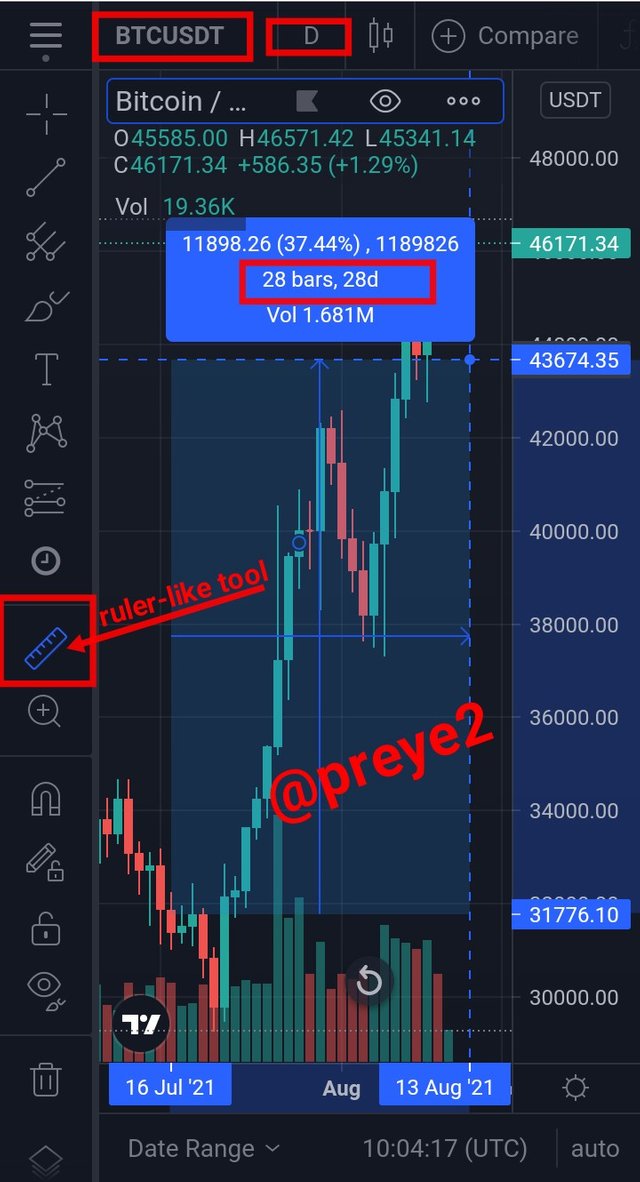
As you can see in the screenshot above, the area highlighted by the ruler contains 28 bars which signifies 28 days, because the chart is in a 1 day timeframe.
2. Text Tool: This tool is used to add writings to your charts. you can write down anything that might be useful to you in one way or the other. Below is a DASH/USDT pair.
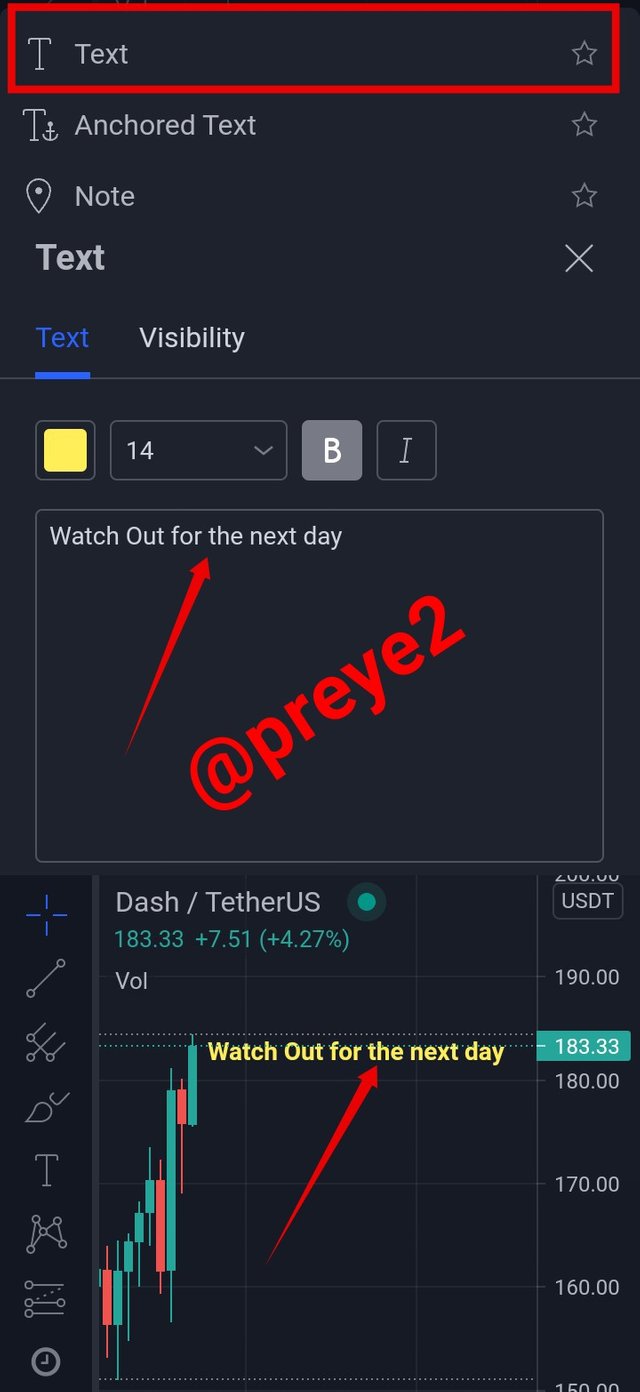
As you can see in the screenshot above, I added a text to my chart, stating "Watch out for the next day", and it's in bold and yellow colour.

How to add Indicator in chart
The steps below can be used to add any kind of available Indicator to your chart, as long as you spell it out on the search bar. For illustration purposes, I will be using the Smoothed Moving Average.
- I selected the
DASH/USDpair with a 1 day timeframe - To add the Smoothed Moving Average, I clicked on the "Indicator tab"
- In the search bar, I typed and selected "Smoothed Moving Average",
- And Boom! Smoothed Moving Average was successfully added to my chart.

How to modify an Indicator in chart**
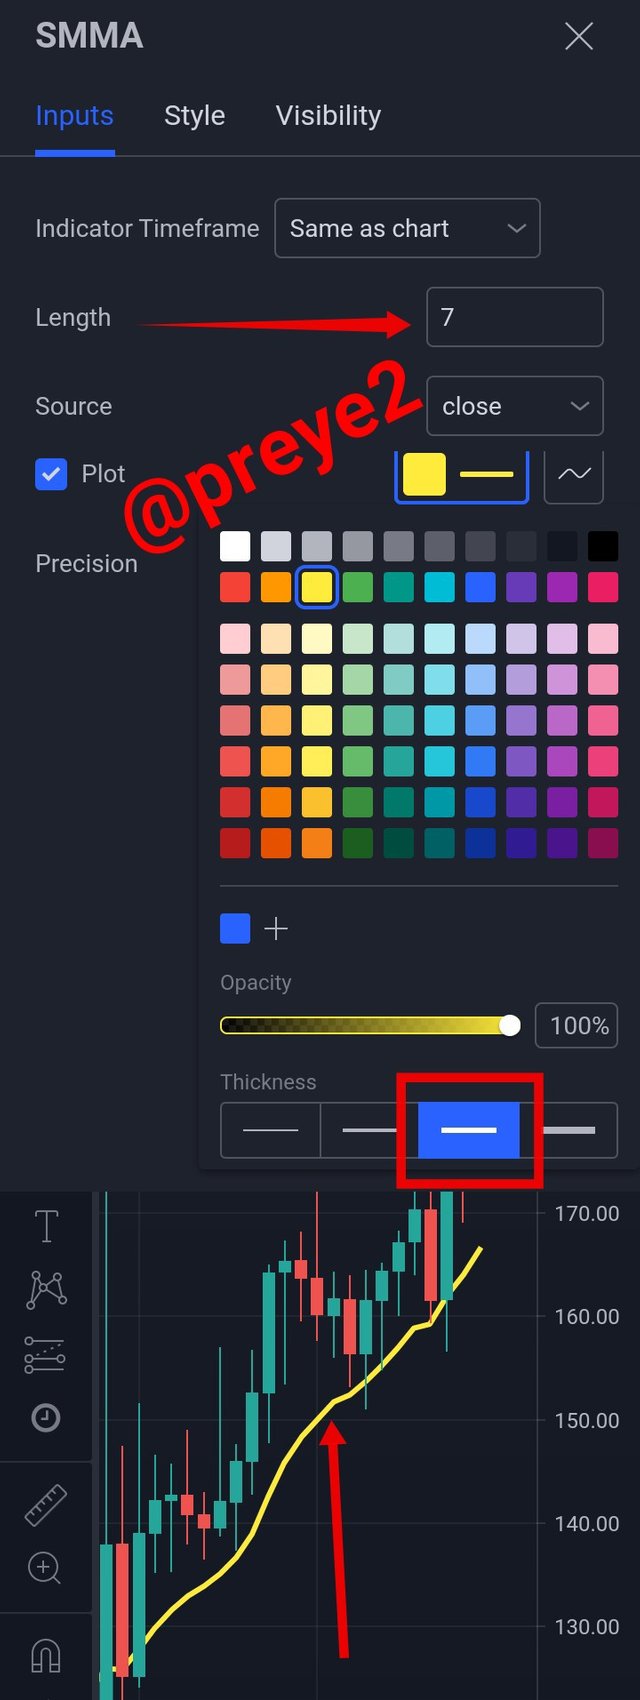
- To configure the SMMA, I tapped on it, and clicked on the setting icon
- I left the length at 7, I increased it's thickness, and changed the color to yellow.
My Favourite Indicator and why I like it
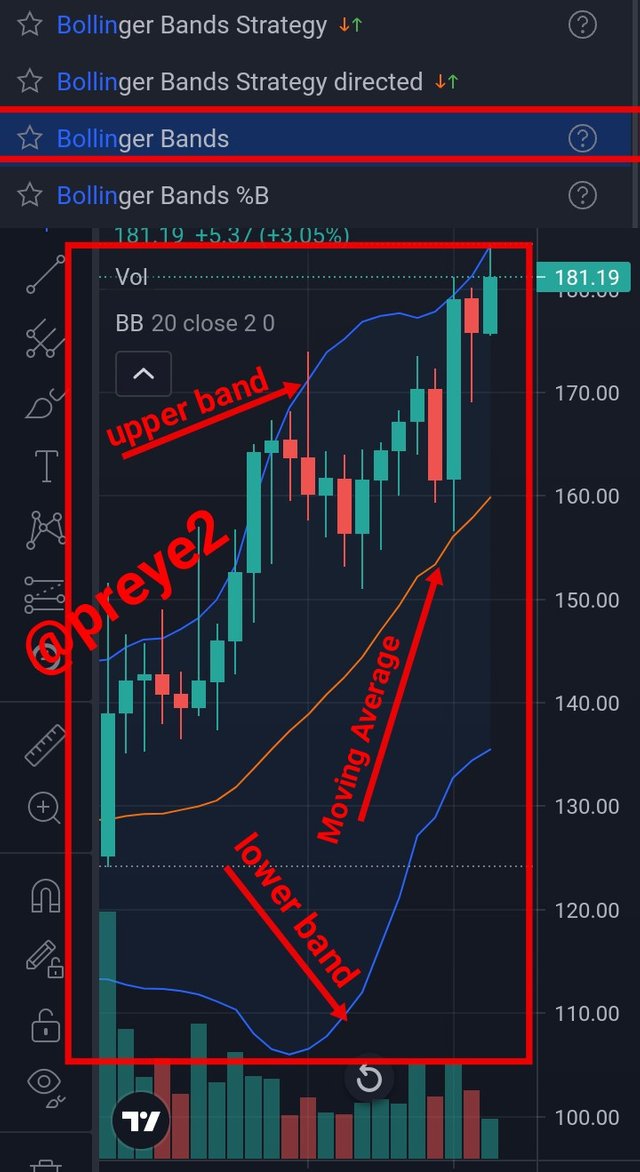
My favorite Indicator in the tradingview website is called the "Bollinger Band" Indicator. It is used for measuring volatility.
The reason why I like this indicator is that it helps traders to see what volatility is like and to know how volatile the market is at that moment.
The wider the separation between the upper and lower band, the more volatility is experienced, and the current trend may be likely coming to an end. And when prices crosses over the bands, it indicates continuation of a strong trend.

My opinion on the usefulness of tradingview in predicting the market for cryptocurrency (trend/price)
Tradingview is one platform that has so many good indicators which can be used to predict the crypto market. Some indicators in tradingview such as the RSI, Bollinger Band, MACD and so on, can be clearly used to indicate a longer lasting up or downtrend.
It has been mostly observed that when a cryptocurrency breaks out from the resistance line, the price of that coin will start growing higher.
Cryptocurrencies can sometimes seem unpredictable, but tradingview with the support of it's differs indicators can be used to predict trends and prices in the market.

Conclusion
Tradingview is so much more than a chart software, it has many technical analysis tools, as well as some amazing features like the watchlist, screener, economics news and so on. Traders can equally set trade alerts, and even integrate their brokers. Another interesting feature of the tradingview is that it has a social network that helps traders and investors to connect with one another.
It is great for both beginners or advanced traders, because of its various subscription plans.
Tradingview is an affordable platform for trading and investing, and currently one of the best trading site in the world.
So am grateful to professor @yousafharoonkhan for bringing this topic to us this week.
Respected first thank you very much for taking interest in SteemitCryptoAcademy
Season 3 | intermediate course class week 7
Thank you for your guidance and remarks so far respected Prof. @yousafharoonkhan, I will surely start reducing the sizes of my images