Crypto Academy / Season 3 / Week 4 - Homework Post for professor @asaj / by @preye2
Hello All,

Source

The Commodity Channel Index (CCI) is used to measure the Current Price Change relative to theAverage Price Change over a period of time.
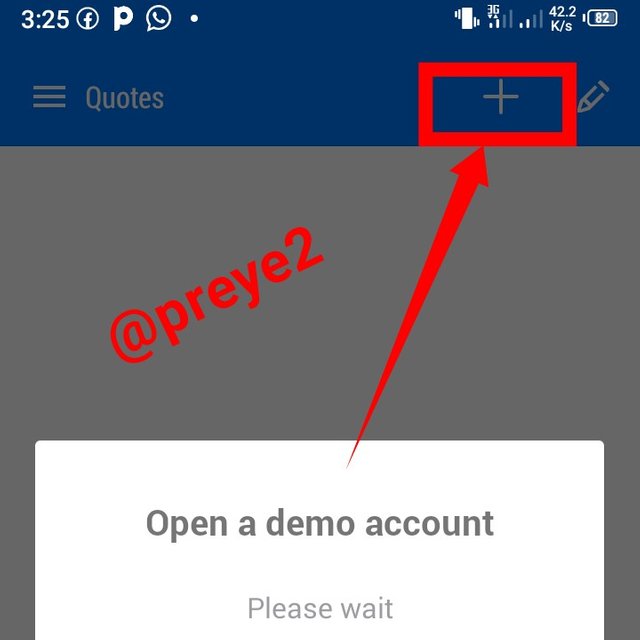
So I will be opening a demo account on the MetaTrader 5 broker, to demonstrate my understanding on CCI.
Selecting five cryptocurrency pairs
I selected 5 cryptocurrency pairs using the following steps:
Tapped on the plus (+) symbol on the top right hand of my quote screen.
Then I clicked on Crypto in the drop list.
And finally, I selected the cryptocurrency pairs I wanted, and clicked Done.
As you can see in the screenshot below, I selected the following cryptocurrency pairs:
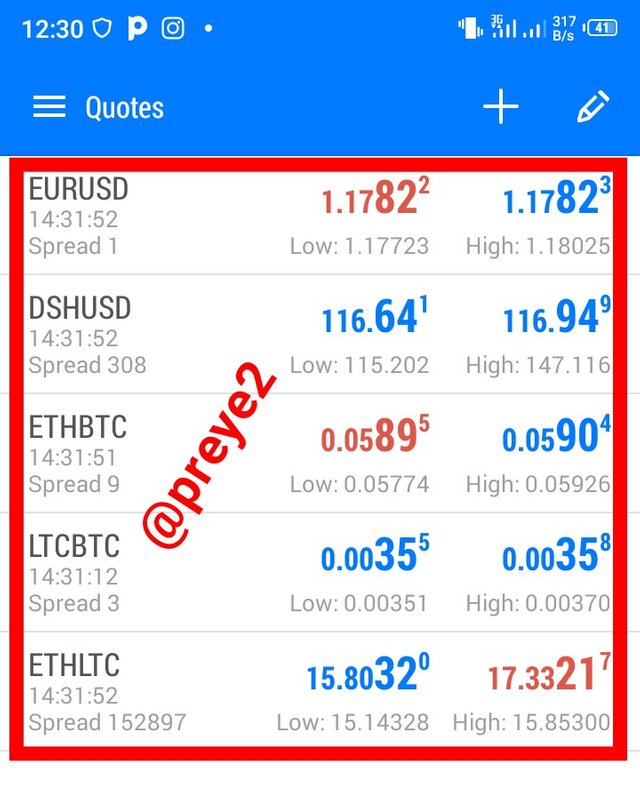
1. EUR/USD
2. DSH/USD
3. ETH/BTC
4. LTC/BTC
5. ETH/LTC
My Entry and Exit Strategy
I will be using the CCI indicator to create my entry and exit strategy. First things first, I will get the CCI indicator into my chart, using the following steps:
I clicked the indicators button.
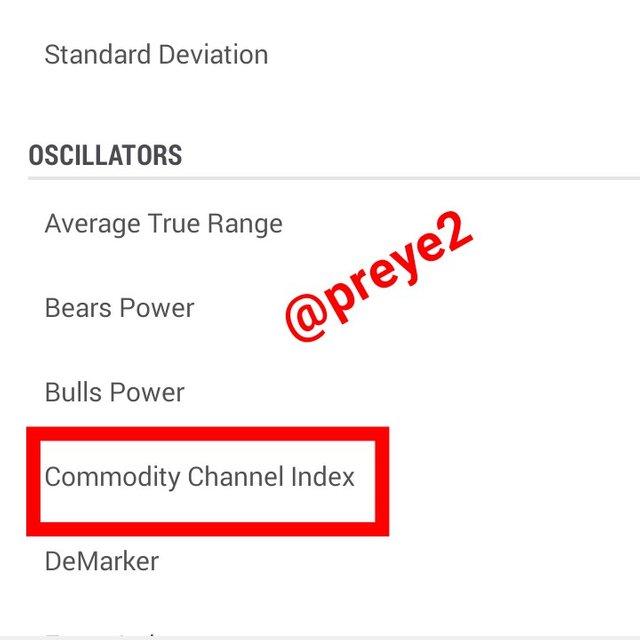
And under
OSCILLATORS,I the clicked on Commodity Channel Index (CCI)
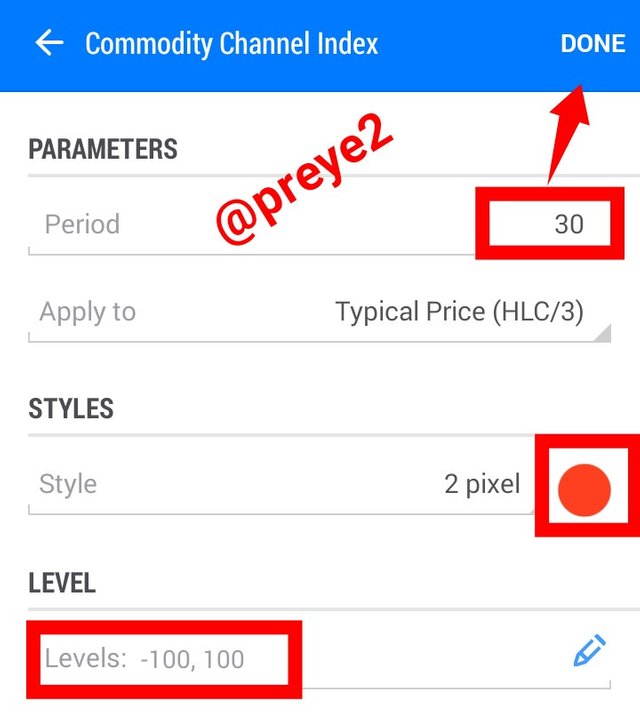
And Finally, I had to set the period to 30, and a band level of +100 and -100.
My entry and exit strategy is called Trend Direction Trading. This is a strategy of buying a token when it's price trends increases, and selling it, when the price trends decreases, with the hope that the trends continue..
my strategies
CCI Length = 30
Time frame = 1 Day
Band level = +100 and -100
Entry Strategy: I will have to open/buy a trade, when the CCI line that was below -100, increases above the upper band (+100). This means when the CCI line crosses above +100, a buy signal has occurred, and further uptrends will result to better profits.
Exist Strategy: I will have to close/sell a trade, when the CCI line that was above +100 decreases below the lower band (-100). This means when the CCI line crosses below -100, a sell signal has occurred.
Using Commodity Channel Index (CCI) of length 30, I will have to buy/sell some coins
Starting from the DSH/USD pair.

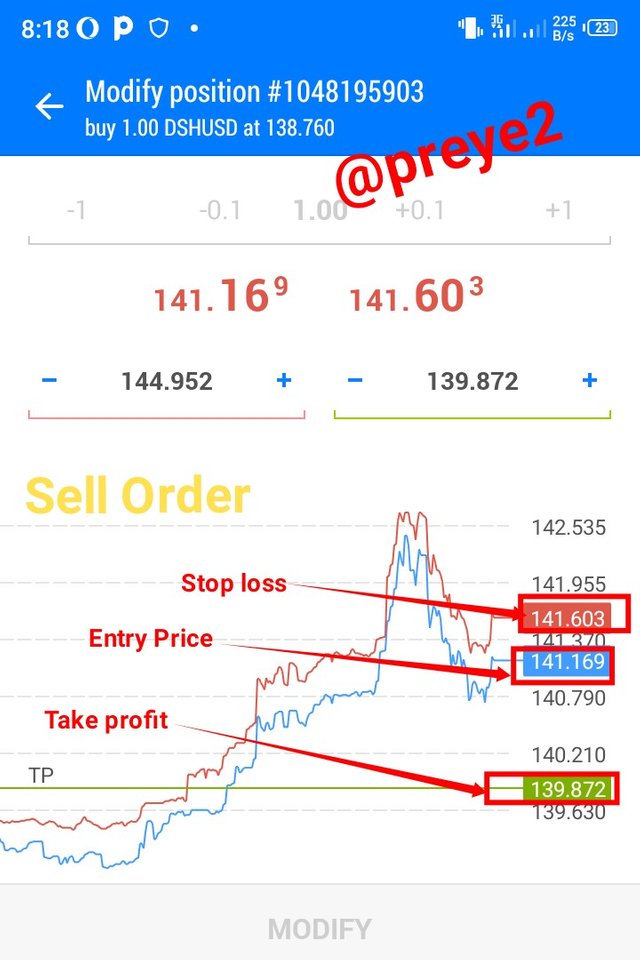
On the 30 minute timeframe chart, I observed that the CCI line has crossed above the +100 band, so I decided to place a buy order. And for profit purposes, I had to set my stop loss and take profit.
The EUR/USD
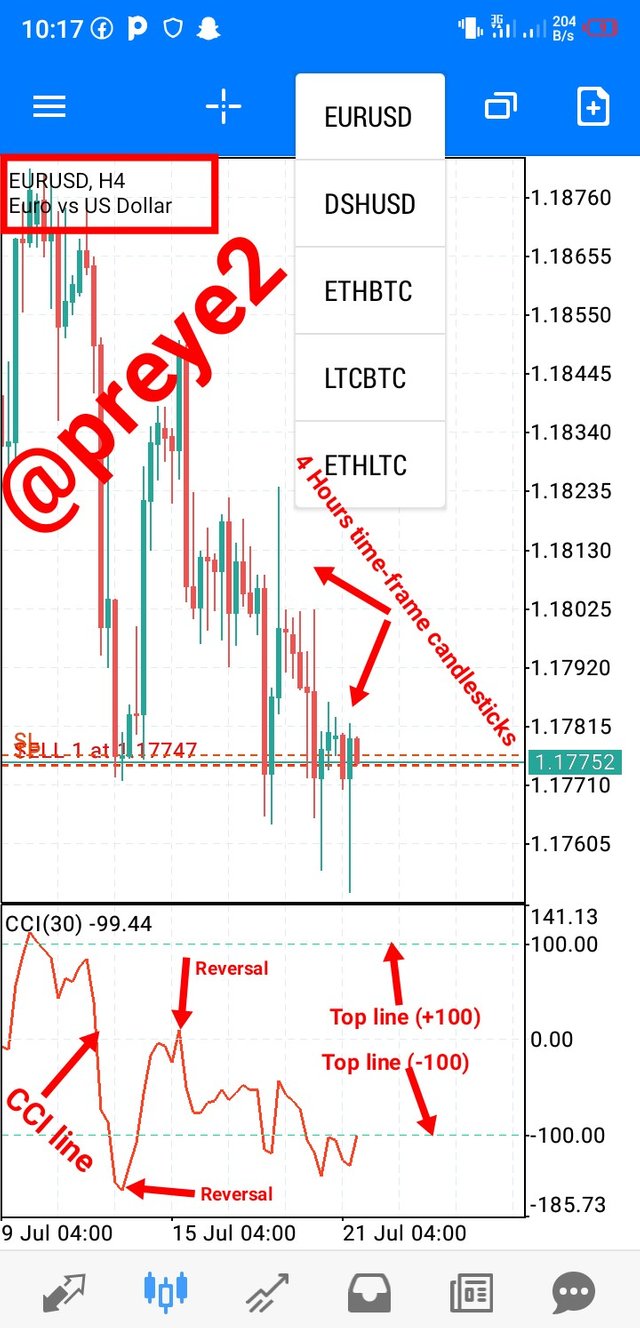
On a 4 hour timeframe chart, I discovered that the CCI line was below -100 band, so I decided to place a Sell order, and I equally set my stop loss, and take profit.
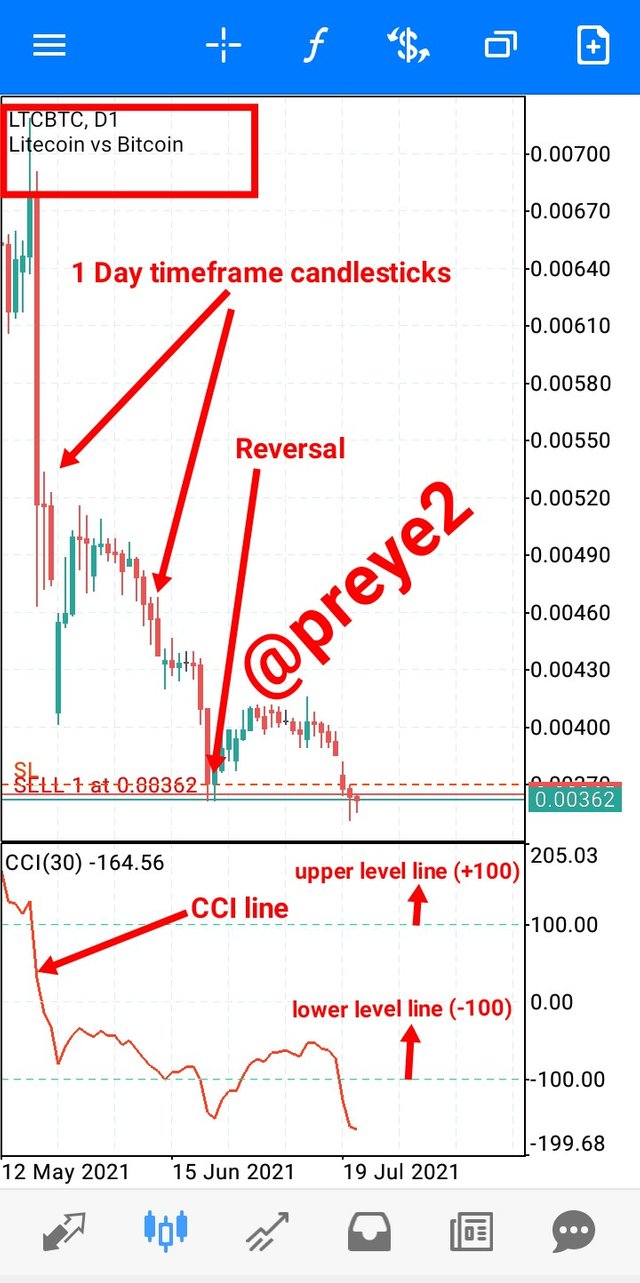
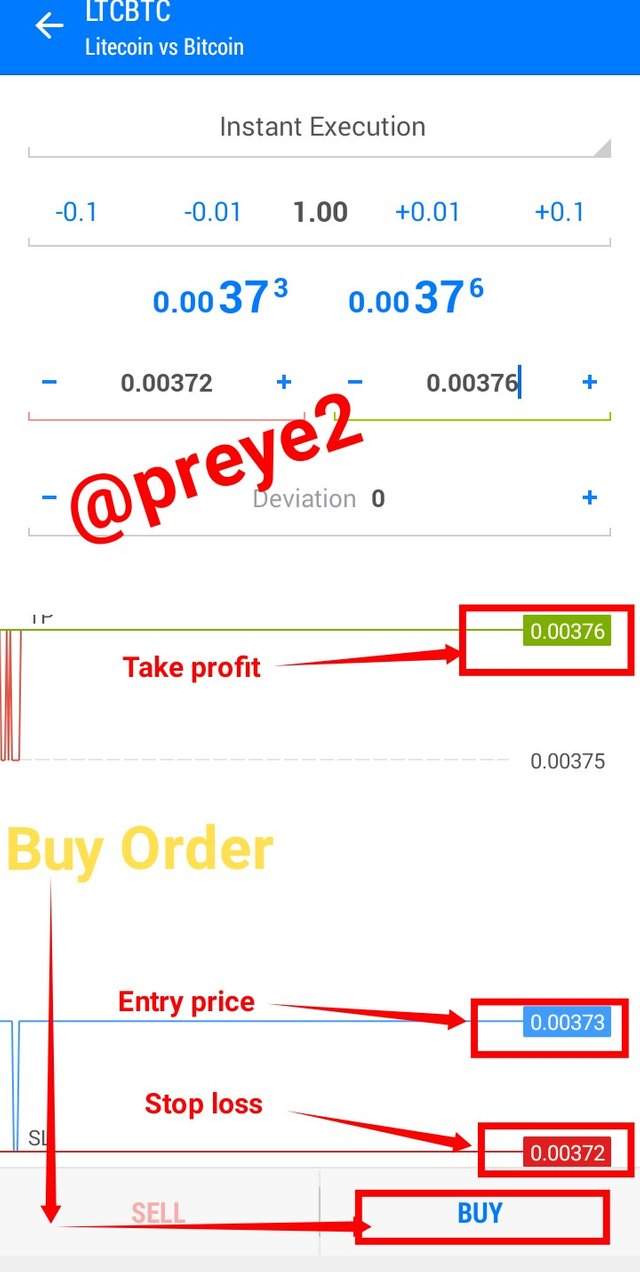
On the LTC/BTC chart, using a 1 Day timeframe, I placed a sell order because the CCI line crossed below -100.
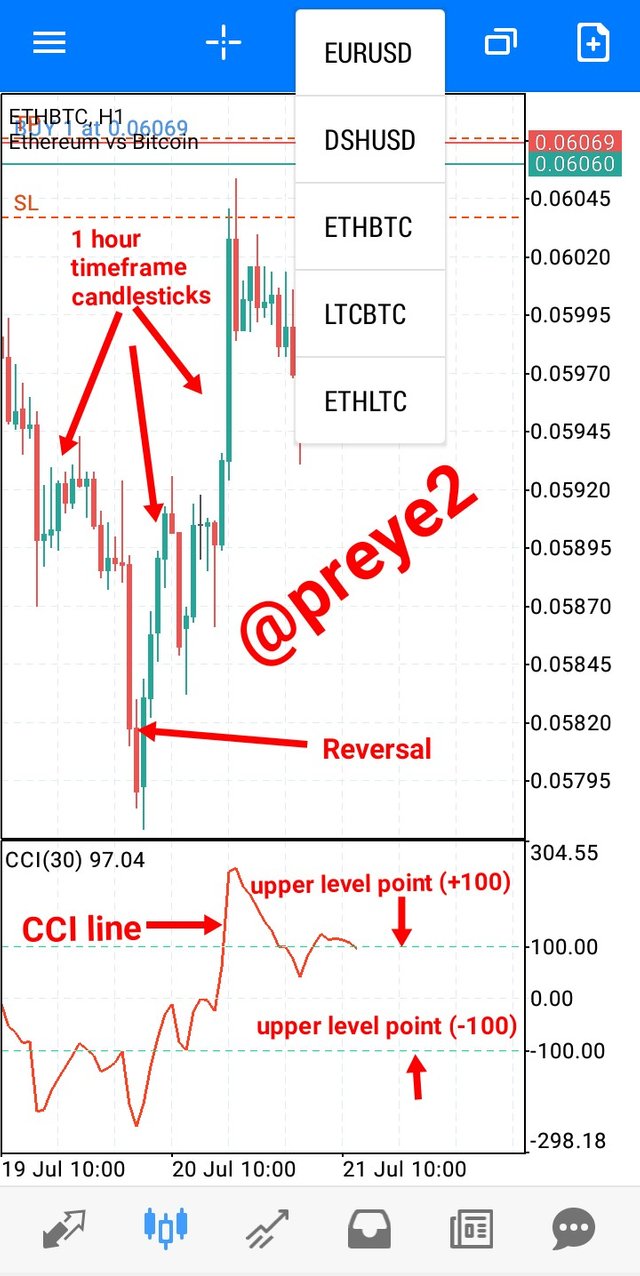
I placed a buy order on a 1 hour ETH/BTC pair chart, because the CCI line is above the +100 band, and I equally had set my stop loss and take profit.
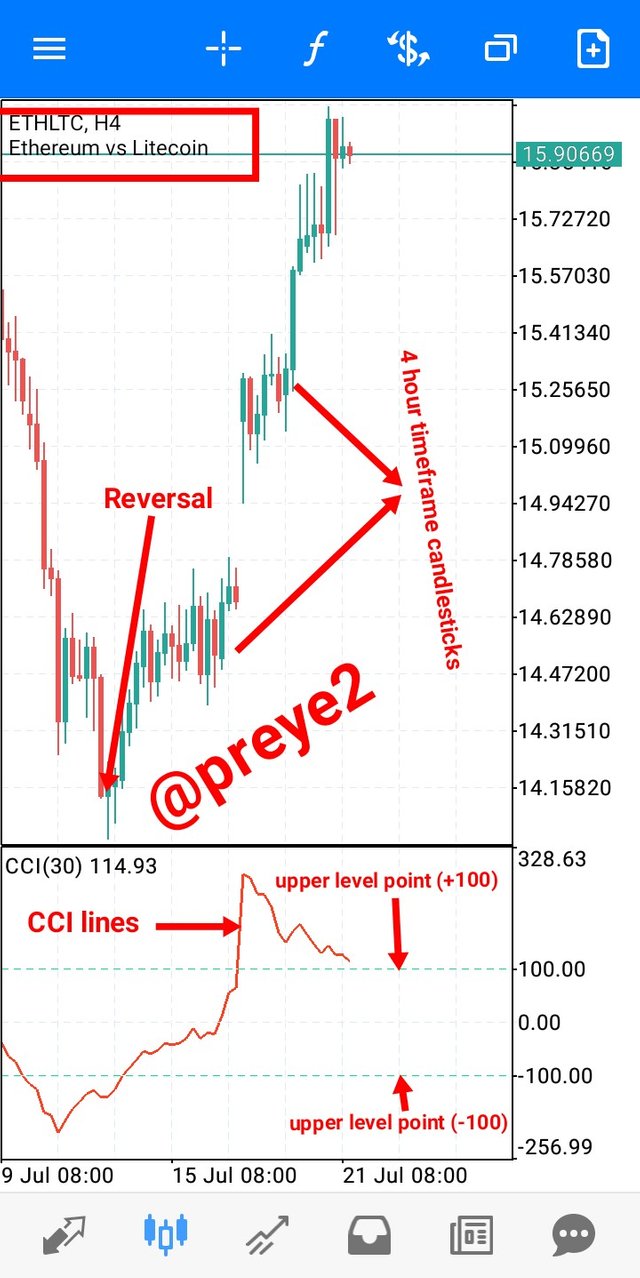
As you can see in the screenshot below, this is an ETH/LTC pair on a 4 hour timeframe, as the CCI line crosses the +100 band, I placed a buy order.
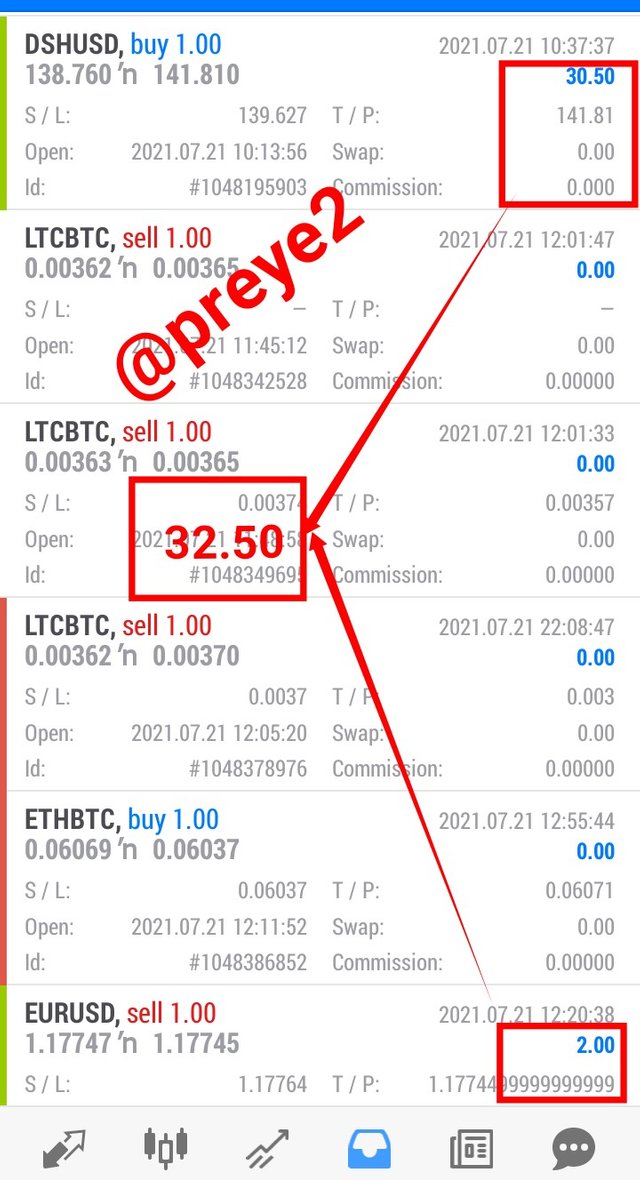
Declaring My Profit
So far I made multiple trades, but I was aiming at getting a quick profit out of the trades, and because of that I made a total profit of $32.50.
My Trade Management Technique
It is true that a good Management Technique forms the basis for a successful trade.
- Observing and Understanding the Pair Chart: My first management technique was observing how the market trend was doing, because this will help me to determine when and how to enter the market.
I used the CCI line to identify reversals, and observing the upper and lower line bands (+100 -100) for my entry and exit points as the case my be.
After my observations, I decided to entered a short term trade, and I opted for a quick profit, immediately after the CCI line crosses the +100 or -100 mark, I placed my orders.
- Stop Loss and Take Profits:
I implemented the stop loss and take profit to almost all my trades, because in some cases the prices moves opposite the choosen direction. So below is what I did:
If I am placing a buy order, my stop loss would be below the entry price, while my take profit would be above the entry price. So if the price eventually gets to either of the lines, the buy order will automatically be executed.
If I am placing a sell order, my stop loss would be above the entry price, while my take profit would be below the entry price. So if the price eventually gets to either of the lines, the sell order will automatically be executed.
Conclusion
I will conclude by saying that Meta Trader 5 (MT5) is one of the best broker to use, because it's free, and it's package provides you with everything you need to analyze the market.
CCI is a momentum based indicator that falls under the oscillator class. And after using the CCI, I got to know that the indicator helps to identify a strong and weak market.
I thank professor @asaj for teaching such an educative topic, because this lecture equally taught me that planning your trades (Trade Management Technique), is a very important aspect in trading.
Good job @preye2,
Thanks for performing the above task in the fourth week of Steemit Crypto Academy Season 3. The time and effort put into this work is appreciated. Hence, you have scored 8 out of 10. Here are the details:
Remarks:
Preye, you have demonstrated a good understanding of the topic and have completed all the tasks. You have also provided screenshots of all your activities on MetaTrader 5.
This would have been a perfect work if you had used other indicators to confirm or reject the CCI signals. Also, it appears you bought some coins when the CCI line was already in the overbought territory. That is a very risky decision as the price of the coin could drop at any moment.
That aside, this was a really good work.
Thanks alot respected professor @asaj, for your lectures, corrections and guidance, I really appreciate.
And I promise to improve in my homework tasks for #SteemitCryptoAcademy.