Steemit Crypto Academy / Season 4 Week 2 - Homework Post for @reminiscence01 | Technical Indicators.
.jpg)
Hello Steemians,
Its the 2nd week of season 4 in the Steemit Crypto Academy, and this is my homework entry for Professor @reminiscence01 on Technical Indicators.

- a) In your own words, explain Technical indicators and why it is a good technical analysis tool.
Technical indicators
Technical indicators are tools or signals which are used mathematically to calculate the entry and exit point of an asset in a market during trading.
Technical indicators gives the historical details of an asset price movement and volume thereby giving traders a clearer interpretation of the future price movement and a trading opportunity.
Technical indicators are special tool which enhances the use of technical analysis. It is an important tool in technical analysis because it help traders to know the market condition which points out possible trading opportunities by sending buy and sell signals to traders.
There are different kinds of technical indicators used by traders in the market during technical analysis. These types of indicators will be discussed in the number 2 section of this assignment.
- b) Are technical indicators good for cryptocurrency analysis? Explain your answer.
Yes, Technical indicators are good tools for cryptocurrency analysis when properly applied.
Technical indicators are the core pillars in technical analysis in the trading market.
Technical indicators are used for prediction of market price movement of cryptocurrencies. It tells if the price of a currency is trending and if the trend is a downward or an upward trend. It indicates also when a currency price is ranging. Knowledge of the price movement of a security help traders to take advantage of strong fluctuations and make the right decisions during trading.
Technical indicators also give traders the price history which can help tell traders about the future price of a cryptocurrency, it also gives the price momentum and trading volumes which will likely tell the future volume of the currency.
Technical indicators also help traders with entry and exit signals which help traders prevent losses during trading.
- c) Illustrate how to add indicators on the chart and also how to configure them. (Screenshot needed).
In adding indicators to a chart, I followed the the steps below;
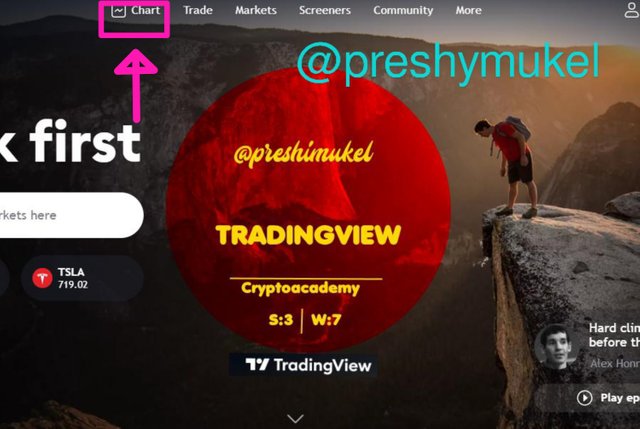
- I visited the trading view website
When the site opened, I clicked on chart.
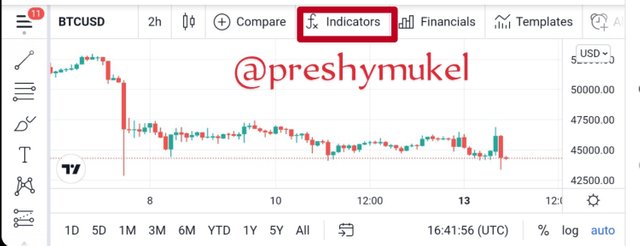
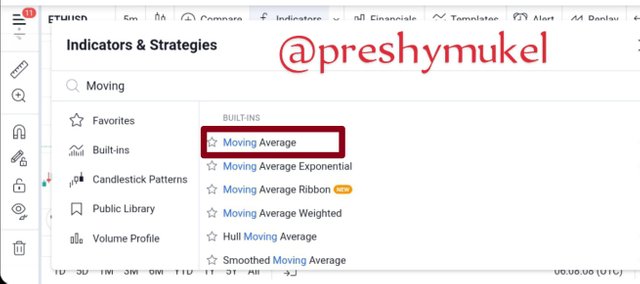
- A chart opened, and then I clicked on indicator to add any indicator of my choice.
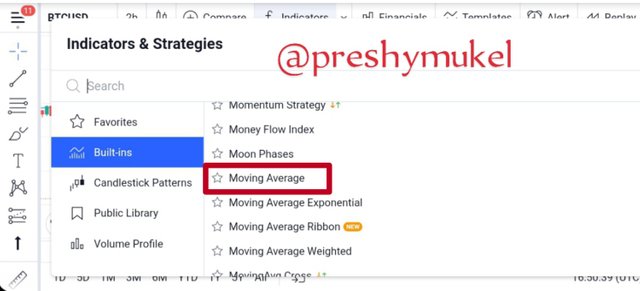
- A list of indicators appeared, and I clicked on moving average twice to add two moving average (short and long term MA) indicators to the chart.
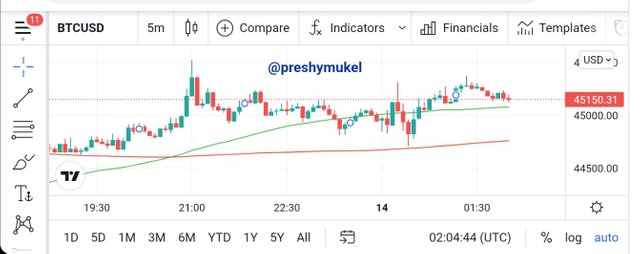
- From the chart below we can see that the moving average indicators has been added to the chart.
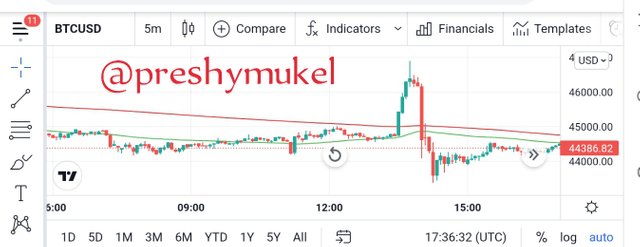
Configuration of the MA Indicator
- To configure the MA, I double clicked on it and a dialog box appeared.
- I went ahead to set the length of the long term MA as 200 and the colour as red.
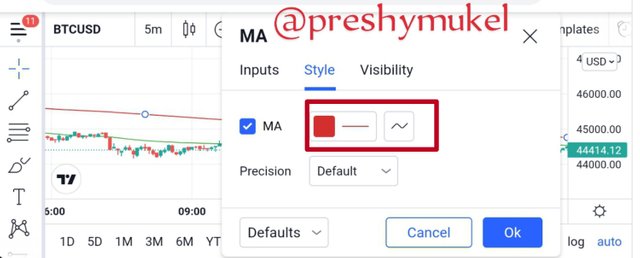
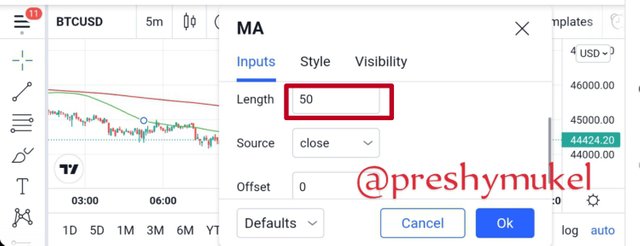
- I also set the length of the short MA as 50 and the colour as green.
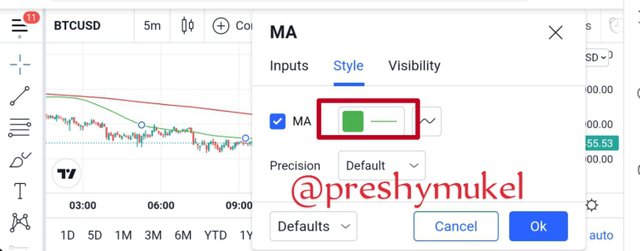
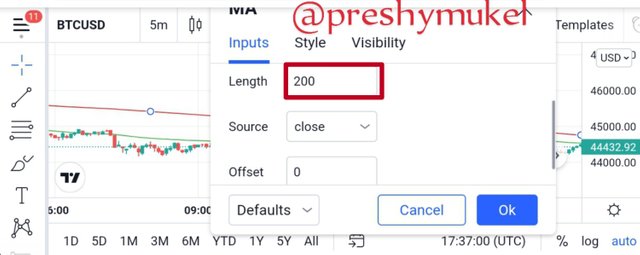
- Configured MA indicators on the chart as seen below.
NOTE: You can add as many number of indicators you want on a chart, but when combining indicators it is advisable to always combine indicators that works perfectly together inorder to get an accurate signal.

2 a) Explain the different categories of Technical indicators and give an example of each category. Also, show the indicators used as an example on your chart. (Screenshot needed).
There are different categories of technical indicators. They are as follows;
1. Trend Indicators
Just as the name implies, the trend indicators were mainly developed to assist traders in identifying the trend of the market during trading .
Some examples of trend indicators are; Moving Average (MA) Indicator, Average Direction Index (ADX) Indictor, Ichimoku Indicator etc.
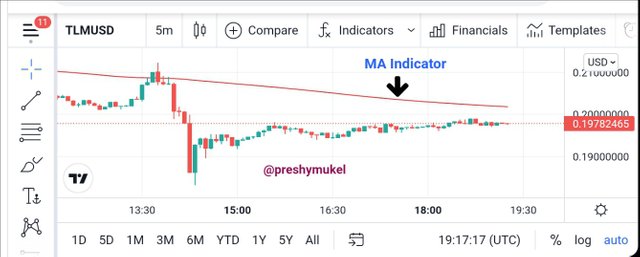
- Moving Average (MA) Indicator: The moving average is a trend indicator, and as a technical indicator or tool in a chart it gives traders a clearer interpretation of the average price movement of an asset at a particular given time frame. Moving average is simply the closing sum of an asset divided by the the number of periods.
Moving average is represented in a chart with lines.
Moving average are of different forms; the Exponential Moving Averages, Simple Moving average, and Linear Moving Averages.
Example of a moving average indicator on a chart
2. Oscillator Indicators
Oscillator indicators are technical indicators which are regarded to as momentum indicators which help traders to signal oversold and overbought in a market.
Examples of Oscillator indicators are; Stochastics Indicator, Relative Strength Index (RSI) Indicator, Moving Average Convergence/Divergence (MACD) Indicator, Commodity Channel Index (CCI) Indicator etc.
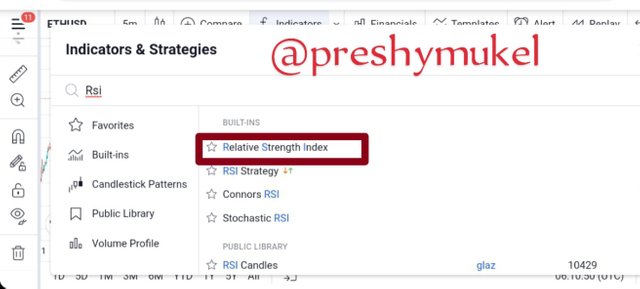
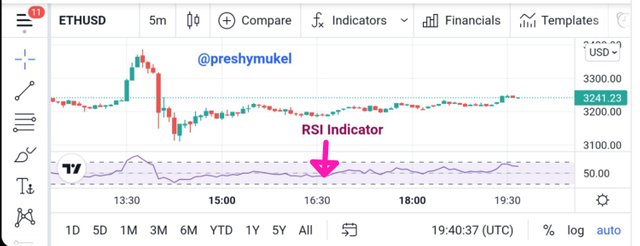
- Relative Strength Index (RSI) Indicator: The RSI is the most used Oscillator indicator. An oversold is represented as when below 30 in a bound of 0 – 100 while an overbought is when above 70. This formula helps to signal traders when to buy and sell an asset, as they sell their asset when the bound is above 70 and buy when its below 30.
Example of a Relative strength index indicator on a chart
3. Volatility Indicators
This type of technical indicator shows how volatile a currency is, the volatility indicators help traders to know the low and high of a currency during technical analysis. This indicator help traders to know the volatility of a currency before entering a trade.
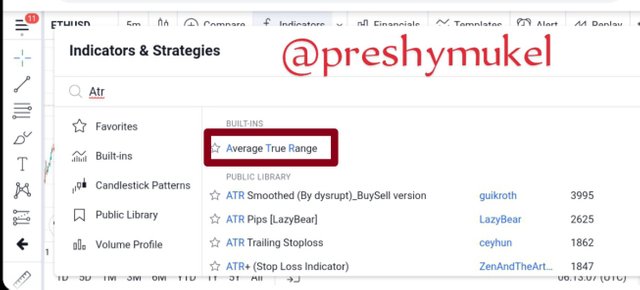
An example of Volatility Indicator is the Average True Range (ATR) Indicator.
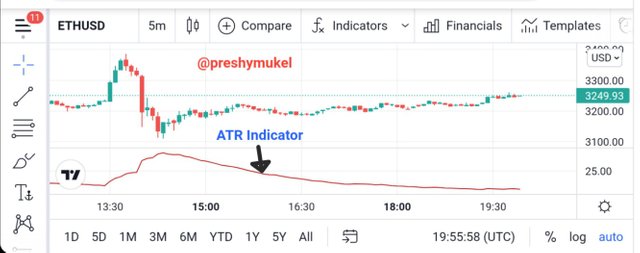
- Average True Range (ATR) Indicator: It shows the average distance between low and high. A higher ATR is represents that an asset is volatile and a lower ATR represents a nonvolatile asset.
Example of an Average true range indicator on a chart
4. Volume Indicator
Volume indicators tells about the strength or the price action of a currency in a trend based on volume.
Some types of Volume indicators are; Chaikin Money Flow, Accumulation / Distribution indicator, Money flow index, On-Balance indicator, Volume RSI.
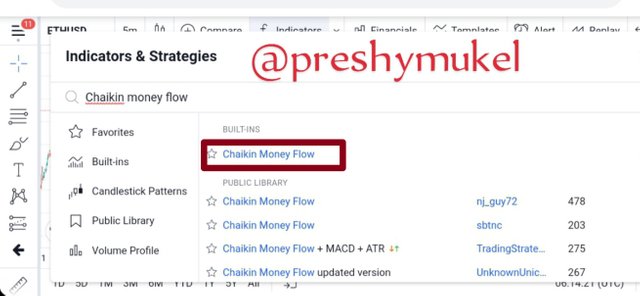
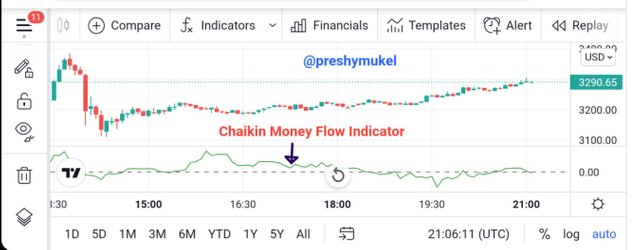
Chaikin Money Flow Indicator: This type of technical indicator is used to determine the flow of money in a market over a period of time. It is used to determine the inflow and outflow of money in a market.
Example of a Chaikin money flow indicator on a chart
2:-b) Briefly explain the reason why indicators are not advisable to be used as a standalone tool for technical analysis.
Indicators when used as standalone tool most times gives wrong signals thereby leading to bad trading decisions.
Different indicators give different interpretations in a market and these different interpretations are used to compliment each other, which help to yield a stronger and better analysis.
Therefore for a better result during trading, It is advisable for traders to know indicators that work well together as no indicator on its own can be 100% accurate and also the wrong combination of indicators can give a wrong signal/interpretation.
Proper combination of indicators help traders to limit loss risk.
2:- c) Explain how an investor can increase the success rate of a technical indicator signal.
Technical indicators success rate differs from one trader to another.
Technical indicators Success rate is dependent on many things such as;
Proper application of indicators: An investor can increase the success rate of a technical indicator through right application of the indicator.
In the application of technical indicators, it is good to note that different indicators have their own specific parameters used in their configuration which enable them function properly.Timing: Timing is another key an investor can use to increase the success rate of an indicator. After spotting a trading signal using a technical indicator, it is very important for an investor to be available at the time the signal will appear inorder to execute the trade which will thereby increase the success rate of the indicator.
Trader/investor’s experience: “Experience is the best teacher”, an investor who has a high technical indicators experience level will definitely know how to use technical indicators better than the ones with low or no experience at all. Knowing how to use indicators is the key to its success.
Market condition: Before the application of a technical indicator, the market movement should be known whether it is ranging or trend inorder to add an indicator that will suit with the market condition and at the end of the day will yield a good result.

Conclusion
Technical indicator is a strong tool in crypto analysis as it helps in the prediction of market price movement and also opens up trading opportunities for traders.
However, it is important to note that no technical indicator on its own is 100% accurate and that is why it is advised that indicators be combined to compliment each other for a better result.
Thanks Professor @reminiscence01 for the wonderful lecture, it was superb.
Hello @preshymukel, I’m glad you participated in the 2nd week Season 4 of the Beginner’s class at the Steemit Crypto Academy. Your grades in this task are as follows:
Recommendation / Feedback:
Thank you for completing your homework task.
Thanks for the kind review Professor @reminiscence01
To the notice of @reminiscence01 and @steemcurator02 my post have not yet been curated. Its been 6days since I made the post.