Steemit Crypto Academy: Season 3 Week 4 | Candlestick Patterns | Homework Post for Prof. @reminiscence01

Hello Steemians;
It's Week 4 of Season 3 in the Steemit Cryoto Academy. This post is that of our able Prof. @reminiscence01 on Candlestick Patterns.
Here's my entry:
INTRODUCTION
A Candlestick pattern is an essential aspect of technical analysis as it help traders/ investors to be able to forecast the price of any cryptocurrency.
Candlestick chart is one of the simplest and easy to interpret chart for price forecasting, that's why it is widely adopted.
In understanding the anatomy of a candlestick, there are three notable features; The body, color, and the wick.
The body: The body consist of the open and close of a market.
The color: The color of a candlestick shows the trend if a market. Green or white candlestick shows a bullish trend, and a red or black candlestick shows a bearish trend.
The wick: It consist of the low and high of the market price. It is also refered to as the shadow.
The types of candlestick is what I'll be focusing on in this homework task.

- In your own words, explain the psychology behind the formation of the following candlestick patterns.
- Bullish engulfing Candlestick pattern
- Doji Candlestick pattern
- The Hammer candlestick pattern
- The morning and evening Star candlestick pattern.
Bullish engulfing Candlestick pattern
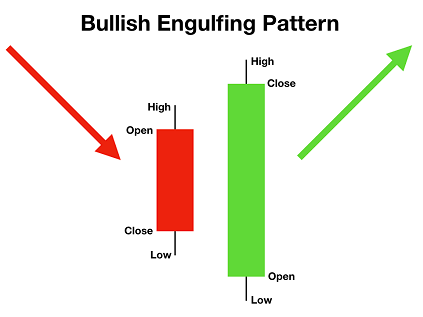
The Bullish engulfing Candlestick pattern is formed when a small red candlestick (bearish candlestick) is followed the next day by a large green candlestick (bullish candlestick), the body of second candle (green candle) engulfs the body of the previous candlestick. A bullish engulfing candlestick pattern represents a two-candle reversal pattern.
In a bullish engulfing pattern, the stock price opens on day 2 with a lower price lower than that of day 1 close, and closes higher then that of day 1 open, this gives the second candlestick the chance to completely engulf the previous candlestick. This also shows that on the day 2, buyers were influencing the market.
The green candlestick of a bullish engulfing pattern sometimes has a small upper wick and sometimes there's no upper wick at all. The presence of an upper wick could indicate that the market closed near to its highest price which means that the day ended while the price was still on the increase.
Lack of a wick could mean that the next day would possibly produce another green candlestick.

Doji Candlestick pattern
Doji Candlestick pattern is formed when the opening and closing of a stock is the same. What this means is that both buyers and sellers are indecisive of the price of a stock.
A Doji candlestick pattern looks like a plus sign. Depending on where the close/ open line falls there are three major types of Doji candlestick, they are;
Gravestone: When a gravestone Doji occurs in an uptrend is signals a decrease in price.
Long-legged: In a long-legged Doji, the price may rise or fall.
Dragonfly: When a dragonfly Doji occurs in a downtrend it signals an increase in price.

The Hammer candlestick pattern
The Hammer candlestick pattern is a bullish pattern that forms when there is a price decline from buyers. The open and close of the price is almost equal.
The formation of a hammer candle indicates that the market is trying to move to the bottom.
Hammer candles appears in the shape of a hammer, it has a real body which appears very small and a long wick. The lower represents price decline.
The price moves up in the direction of the hammer and this process is called confirmation.

The morning and evening Star candlestick pattern.
Morning Star candlestick pattern.
The morning star candlestick pattern represents a bullish reversal pattern. It is usually formed at the end of a downtrend.
Three candles makeup the morning star candlestick pattern.
The first candlestick is always a bearish candle, which means bears are influencing the market.
The second candlestick is a Doji candle and it can be bullish or bearish. The Doji candle indicates that the bears are losing in the aspect of driving the market lower. The bears becomes indecisive of the price and at this point reversal takes place.
The third candle is a bullish which indicates that the bulls are influencing the market.
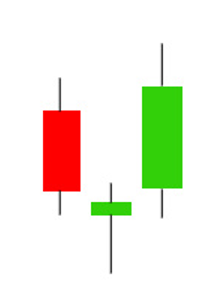
Morning Star Candlestick Pattern Source

Evening Star candlestick pattern.
The evening star is the a bearish reversal pattern that forms after an uptrend. Just like the morning star candlestick pattern, it has three candles.
The first candlestick is a bullish candle showing that bulls are driving the market.
The second candlestick is a Doji candle which can be bullish or bearish. Here the bulls are becoming incapable of driving the market.
The third candlestick is a strong bearish candle. Reversal have taken place and bears have taken over the influence of the market.
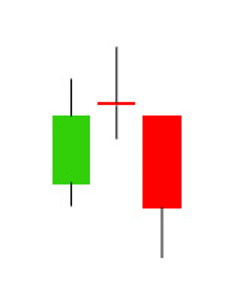
Evening Star Candlestick Pattern Source

Identify these candlestick patterns listed in question one on any cryptocurrency pair chart and explain how price reacted after the formation. (Screenshot your own chart for this exercise)
1. Bullish engulfing Candlestick pattern
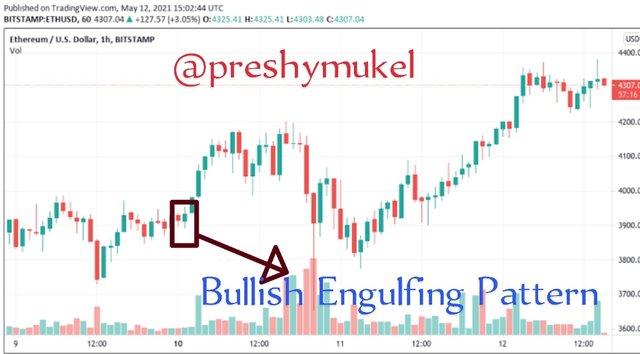
Bullish engulfing Candlestick: ETH/USD Chart
After the formation of a bullish engulfing pattern as observed from the above chart.
The price of Ethereum experienced a bullish reversal which led to buyers taking over in controlling and influencing the market.
2. Doji Candlestick pattern
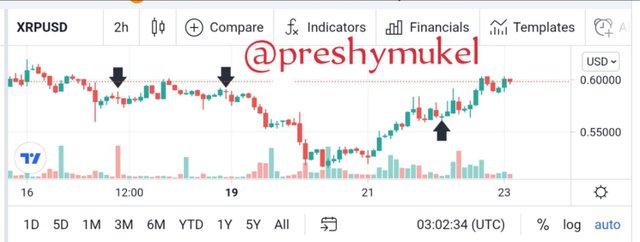
Doji Candlestick: XRP/USD Chart
The Doji candles noticed in the chart above indicates that there was a conflict between buyers and sellers. Buyers couldn't push the price higher and sellers too couldn't push the price lower.
3. The Hammer candlestick pattern
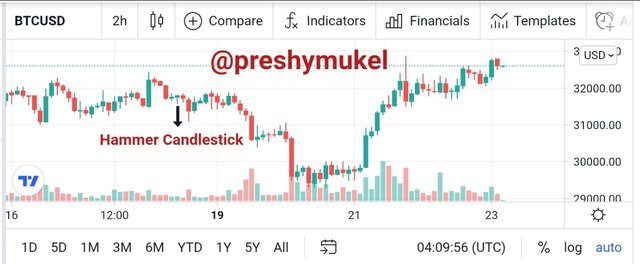
Hammer candlestick: BTC/USD Chart
Hammer candlestick pattern is a strong reversal signal in a trading market.
As seen in the above chart, it shows that there was a change after the appearance of the hammer candlestick pattern. Price reversal occurs in a downtrend after its formation. Which means sellers were in control of the price.
4. The morning and evening Star candlestick
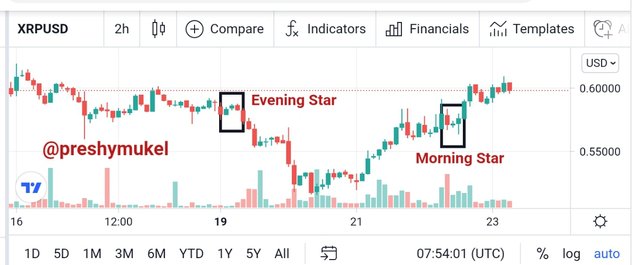
Evening star and morning star candlestick: XRP/USD Chart
After the formation of the evening star candle, there was a bearish reversal in the price thereby putting the sellers in control of the market.
After the formation of the morning star candle the market experienced a bullish reversal thereby putting buyers in charge if the market.

Using a demo account, open a trade using any of the Candlestick pattern on any cryptocurrency pair. You can use a lower timeframe for this exercise.(Screenshot your own chart for this exercise).
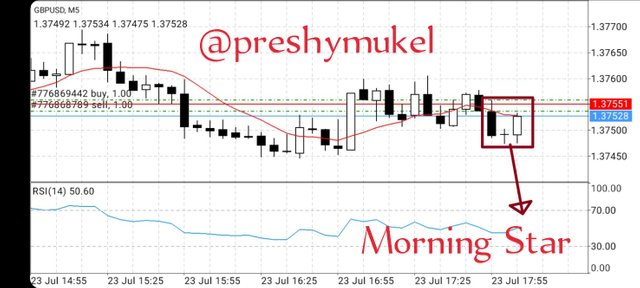
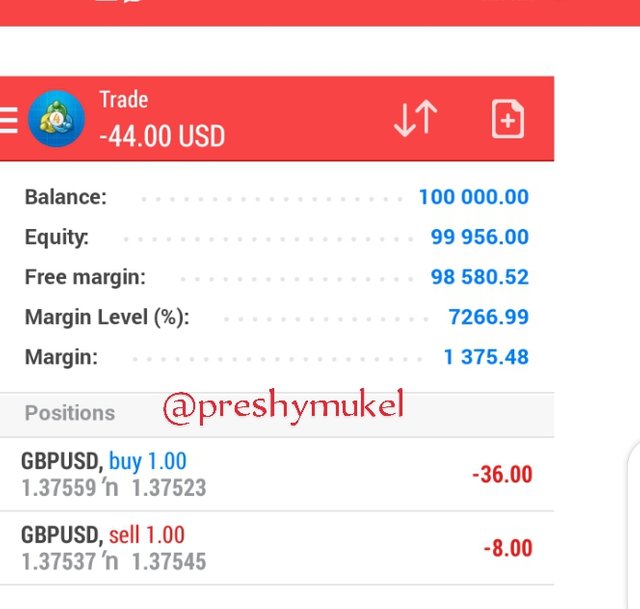
The above trading chart represent GBP/USD on my Meta Trader 4 Demo account using a 5 minutes time frame. When the Morning star candlestick appeared I opened the trade because it represents a bullish trend which is a good sign to open a trade.
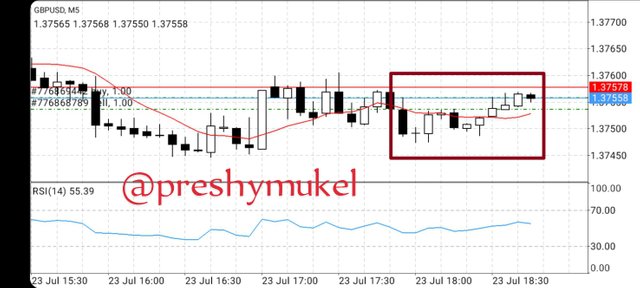
Here's the result of the trade I opened. As seen in the chart above, a bullish trend appears after the formation of the morning star candlestick pattern. It therefore means that buyers took control of the market.

Cc:-
@reminiscence01
.jpeg)
.png)