Crypto Academy Week 14 - Homework Post for @fendit -Elliott Wave Theory.
Thanks Prof. @fendit for the amazing lecture, it was really impactful.
Here is my homework post.
INTRODUCTION
Ralph Nelson Elliot in the 1930s discovered the Elliot wave theory. The theory is used for the forecasting of market price movement based on two types of waves; the impulse waves and correction waves. The Impulse wave usually starts the cycle with wave 1 to wave 5 and the cycle ends with the Correction waves (usually labelled wave A, wave B and wave C).
How do I apply Elliot wave theory?
Firstly, you start the application of Elliot Wave Theory by spotting patterns in market price. In essence, you start by examining waves on chart so as to understand and follow the wave trend in order not to experience losses while trading.
The application of Elliot wave theory gives a trader guide on when to start or stop a particular trade.
The EWT consist of two patterns of wave and these waves pattern make up eight waves which forms a market cycle. In the application of EWT it is very important to be able to spot these waves. The two wave patterns are;
▪️Impulse waves.
▪️Correction waves
The waves moves in bullish and bearish wave patterns; a bullish trend occurs when the price is experiencing an increase, the reverse is the case in the bearish trend.
Wave patterns showing a bullish trend (The part labelled 1-5 are impulse waves while, A-C are Correction waves)
.jpeg)
Wave patterns showing a bearish trend
.png)
IMPLUSE WAVE
Impulse wave is a trading term used to indicate a strong forward market price movement which runs in the same direction of the trend of the next larger size.
Impulse waves consist of five sub-waves and it moves in a straight line in uniform with the direction of the trend of the next larger size. These waves are labeled as wave 1, wave 2, wave 3, wave 4 and wave 5.
▪️Wave 1: it is the beginning of the cycle and it can progress higher or lower depending if it is a bullish or bearish trend pattern. This wave stage can be referred to as the low earning stage. It is best to buy in wave 1.
▪️Wave 2: Here the price goes down slightly but can never extend beyond wave 1 (the starting point).
▪️Wave 3: Wave three is usually the strongest trend of the cycle and it’s also the longest. The price in this wave rises and earning begins to increase. At the beginning of the wave three most traders are still negative but at the midpoint of it more traders get attracted by the price increase and tend to buy.
▪️Wave 4: Here the price begins to rally as the price falls below wave three. It is advisable to buy in this phase if you really understand the trend ahead.
▪️Wave 5: It is the last wave of impulse wave of the Elliott wave theory. There’s a bullish in the wave 5, though it is lower than the wave three in strength.
CORRECTION WAVES
As previously mentioned, the correction wave moves against the trend of the price market, the correction waves are three in number, they are labeled as waves A, B, and C. Wave A and C moves uniformly with the trend while B moves against.
The above mentioned correction waves patterns are categorized into three formations, they are; Zigzag, Flat, and Triangle formations.
Zigzag correction formation
The wave A and C moves in the same direction while B runs against the A and C waves. The B wave is usually the shortest. Zigzags can form to create two or triple zigzag in a correction.
.png)
Source
Flat correction formation
In the flat correction formation, the lengths of all the waves are equal to each other.
.png)
Source
Triangle correction formation
This consists of five wave patterns and these five wave patterns moves against the trend. The triangle formation is usually hard to predict.
.png)
HOW TO EASILY SPOT THE DIFFERENT WAVES
Impulses are made up of five sub-waves; tagged 1, 2, 3, 4, and 5. In trying to spot impulse wave and correction waves, there are tbasic rules to follow in identifying these waves and these rules are;
- Wave 2 cannot go back to the complete volume of wave 1.
- Wave 3 must be the longest wave.
- Wave 4 can never extend over wave 1.
- And the correction waves (A, B, and C waves) must end the cycle.
- Wave B of the correction wave runs again wave A and C trend pattern
If one of the rules is desecrated, it is wrong to label the structure as impulse wave.
MY THOUGHT ON THIS THEORY
I think EWT is the right application for every Crypto trader. It is a reliable application for the forecasting of market price movement following the testimonies of people around, though I don’t have testimonies of my own due to the fact that I am a beginner and still in the learning process.
The EWT is a complicated theory especially for beginners and it’s difficult to identify the beginning and end of waves; with much practice one can easily identify these wave patterns without stress.
It is very import for every trader to have knowledge of EWT
Choose a coinchart in which you were able to spot all impulse and correct waves and explain in detail what you see.
I choose a Bitcoin/USDT 21 minutes chart to explain impulse and correction waves.
The chat below is a bullish trend pattern of waves which shows both Impulse waves and Correction waves. It runs from 3:00 to 3:21
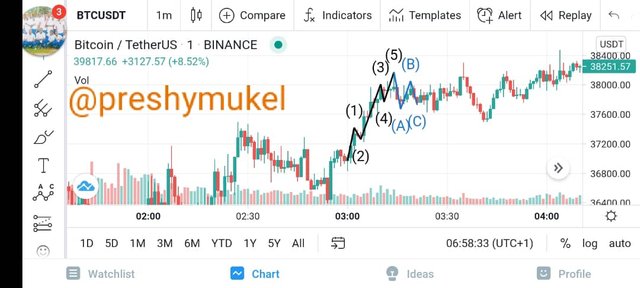
Wave 1 started the cycle by 3:00 with 37000USDT. At this wave level, investor purchase at a very low price. The price bullish for 2 minutes to 37400USDT, the bullish price made some investors to start selling which lead to a bearish price.
The price bearish at wave 2 of the cycle which lasted for like 2 minutes. Here some investors became afraid with the thoughts of running at loss while others are willing to buy due to the drop in price. The drop in price at wave 2 was from 37400USDT to 37300USDT.
At wave 3, the price bearish drastically from 37300USDT to 38000USDT. It was a very long wave stage among all the waves and it lasted for 6 minutes. At this wave stage some investors begins to sell inorder to make profit while others starts buying inorder not to miss out.
The wave 4 of the cycle begins to bearish from 38000USDT to 37800USDT. The wave 4 lasted for 2 minutes.
At wave 5 the price begins to rise again from 37800USDT to 38200USDT, the wave lasted for 3 minutes.
The Pulse waves (wave 1, 2, 3, 4, and 5) run for 14 minutes.
Correction wave begins immediately after the 5th impulse wave, the correction wave started with wave A, at this point the value of the currency depreciated as investors thinks the price won't go high again.
At wave B the price increased a bit and then dropped again at wave C.
Wave C ends the 8 waves of the cycle. The correction waves lasted for 7 minutes. The wave B goes against wave A and C wave pattern.
After the wave C of the correction wave, the cycle starts all over again.
From the above chart, the following was discovered;
▪️Wave 2 of the above chart did not go back to the complete volume of wave 1.
▪️Wave 3 was the longest wave.
▪️Wave 4 did not extend over wave 1.
▪️And the correction waves (A, B, and C waves) ended the cycle, and wave B runs against the trend of wave A and C.
Therefore the waves can be said to be impulse and correction waves because it follows the EWT rules for the identification of waves.
CONCLUSION
The research work I made on this theory these past days has really increased my knowledge in the price forecasting of cryptocurrencies.
EWT is a reliable one though it is a complicated theory especially for beginners. It can be used to make profitable trading if properly studied and applied. My humble advice is that every Crypto trader should adopt this theory but before the application of EWT, one should undergo proper training on how to identify different waves inorder to be able to forecast correctly.
Cc: @fendit
Thank you for being part of my lecture and completing the task!
My comments:
I'm not really convinced by your work. There are many conceptual mistakes and the explanations were not clear.
As well as that, although the pattern was ok, the analysis wasn't. There were many contradictory things.
As a suggestion, make sure you understand the concepts before working on the tasks!!
Overall score:
4/10