Crypto Academy Season 3 week 8 | Intermediate Course: Crypto Assets and the Random Index (KDJ)

Hello Steemians..... I am here again with my homework entry for Professor @asaj on "Crypto Assets and the Random Index (KDJ)".

Question 1: In your own words define the random index and explain how it is calculated
what is Random Index (KDJ)
In the finance market, traders employ different kinds of analysis such as fundamental and technical analysis in order to properly forecast the trend of a stock.
Random Index is an indicator tool used during technical analysis which helps traders to predict the price movement of a stock and a favorable entry point.
The random index (KDJ) was deduced from stochastic oscillator but the only difference is that the KDJ have an extra J-line.
The random index consist of three lines; they are the K, D and J lines, that's why the Random Index is also referred to as KDJ.
What the K, D, and J lines tells
The %K and %D lines indicates if a stock is overbought which is usually represented with 80% or if it is oversold represented with 20%.
Buying and selling usually occurs when the %K crosses the %D. If %K crosses above the %D, it indicates a bullish while %K crossing below the %D indicates a bearish. The J line is what separates the %D value from the %K.
Calculation of Random Index
RSV= ( C−L ÷ H−L )×100
where:
C = The current closing price
L = The lowest traded price of the period
H= The highest traded price of the period
The K, D, and J lines are calculated as follows;
%K = ( 2÷3pK)+ (1÷3RSV)
%D = (2÷3pD) + (1÷3%K)
%J = (3%K) – (2%D)
Where;
pK= The prior value of K.
pD= The prior value of D.
50 should be used when there is no prior value.
Question 2: Is the random index reliable? Explain
Random Index on its own is not completely reliable just like every other indicator, but for a better and favorable signal results, other indicators such as ADX, ATR can be combined with the KDJ indicator.
It is important to note that no indicator can give a 100% accuracy as they only give hints of a market trend and not accurately a 100% of the market outcome. Therefore it is necessary to be guided with risk management strategies, and it also advisable for traders to a longer timeframe in order to get a better result.
Question 3: How is the random index added to a chart and what are the recommended parameters? (Screenshot required)
Steps on how to add Random Index to a chart
First of all I visited TradingView.com
when the home page appeared, I clicked on the three dash lines icon at the top.

- Then I clicked on chart.

- Then a BTC/USD chart appeared, on the chart I clicked on indicator.

- On the search bar of the indicator page, I typed KDJ and then click on the first option (KDJ / ll21LAMBOS21) from the list of options that appeared.

- Then the Random Index was added to the chart as seen on the screenshot below.

- I went ahead to set a default color for the KDJ lines, which I used blue for the K line, red for the D line and black for the J line.
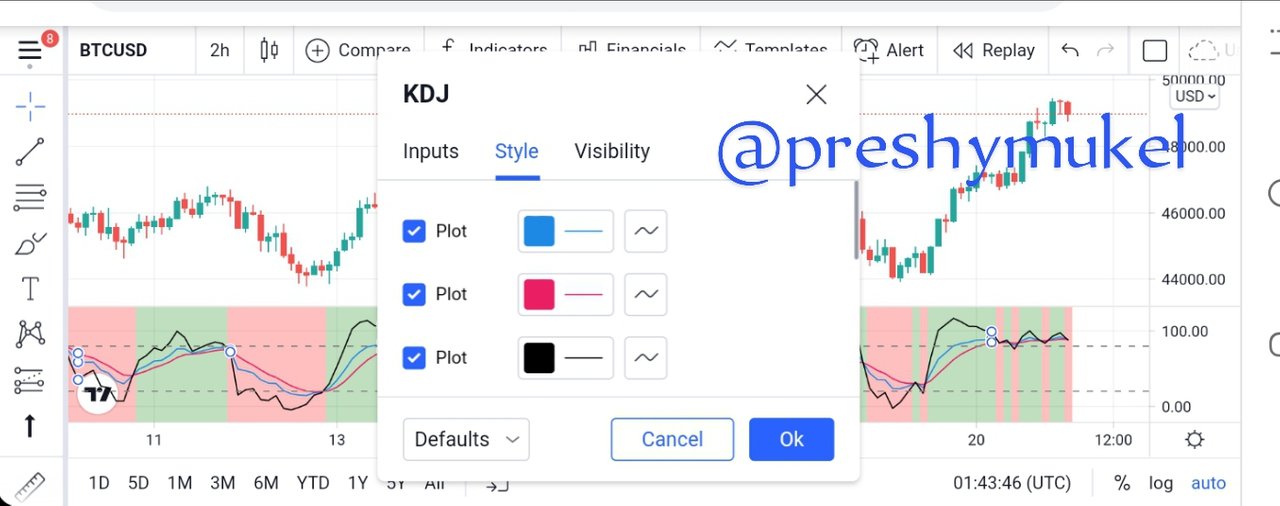
- Set the period and signal to be 9 and 3 respectively.

Recommended parameters for Random Index Indicator.
K line which is represented with a blue color.
D line which is represented with a red color.
J line which is represented with a black color.
Signal which is usually 3.
Period which is usually 9.
Overbought region which is usually represented as 80%.
Oversold region which usually represented to be 20%.
Question 4: Differences between KDJ, ADX, and ATR
Though the KDJ, ADX, and ATR are all indicators used technical analysis by traders, they still have difference that exist between them.
| KDJ | ADX | ATR |
|---|---|---|
| KDJ operates like the stochastic oscillator but with an extra J line. The KDJ indicator is used to predict or ascertain the price movement in a market. | ADX is used by to ascertain strength of a trend. It gives indications of an upcoming reversal trend. ADX works with two indicators (negative and positive directional indicators) which help traders to know if the trend is up or down . | ATR is used to ascertain the volatility of an asset in a market i.e the price movement of an asset in a market over a period. It help traders to determine the best entry time into a trade and exit time. It also help traders to ascertain where to place the stop loss order. |
Question 5: Use the signals of the random index to buy and sell any two cryptocurrencies. (Screenshot required)
In answering the above question I'll be using my demo account (Meta Trader 5) to sell two crypto (BTCUSD and ETHUSD) using the Random Index indicator signals.
Selling of BTCUSD
- First of all I visited TradingView.com in order to spot a signal on the BTCUSD chart. Then I spotted a sell signal and I immediately went to my Meta Trader 5 account to place a sell order.

- On opening my Meta Trader 5, I opened the BTCUSD chart and then clicked on the plus icon at the to right to place my sell order.

- I sent the sell order after setting my stop loss and take profit.

- The order was implemented as seen on the screenshot of the chart below.


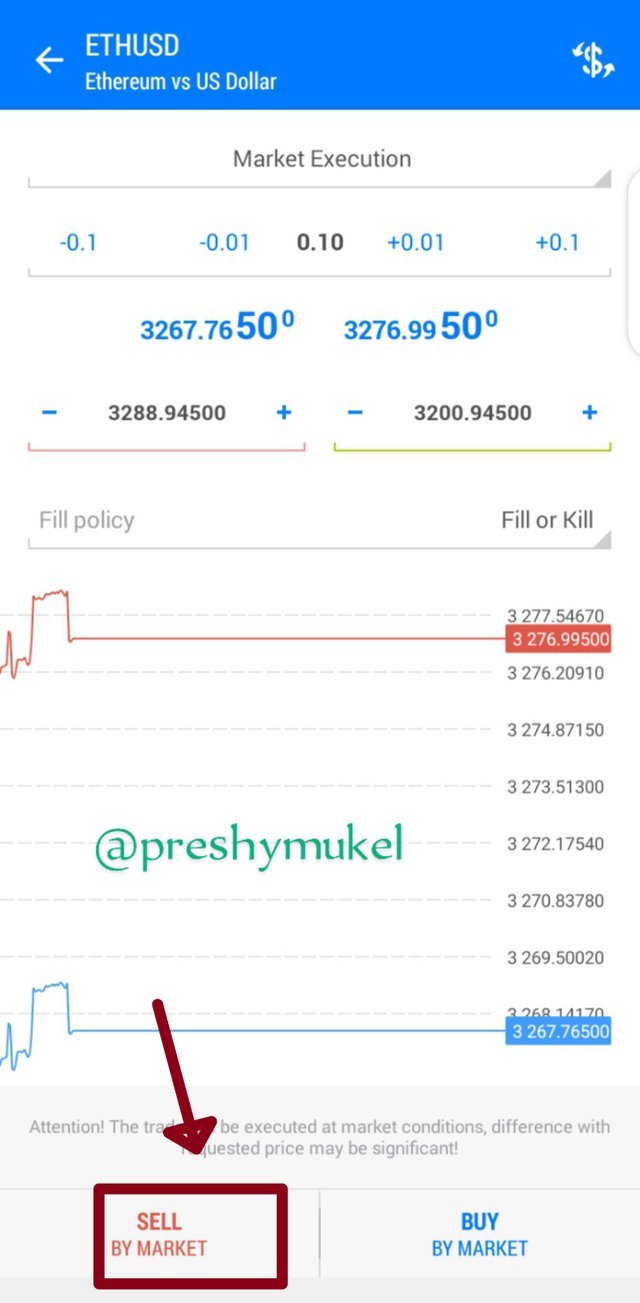
Selling of ETHUSD
- The same steps above were also employed in selling of ETHUSD.
The screenshot below is the ETHUSD chart on TradingView.

- The ETHUSD chart on Meta Trader 5.

A screenshot of the sell order process.
The implementation of the sell order on the ETHUSD chart.


The screenshot below displays the two selling orders I made on BTCUSD and ETHUSD which are still running.

Then after some minutes I returned to view my order history and I noticed that the two orders I made on BTCUSD and ETHUSD, the BTCUSD has entered a profit of 1.14 and the ETHUSD has a loss of 2.22 as displayed on the screenshot below.

Conclusion
The lecture was indeed an eye opener as I have got to know about the Random Index indicator (KDJ) and how to apply it on a chart inorder to be able to determine the price movement of a market.
Thanks; Professor @asaj for the wonderful lecture.
Good job @preshymukel!
Thanks for performing the above task in the eighth week of Steemit Crypto Academy Season 3. The time and effort put into this work is appreciated. Hence, you have scored 7 out of 10. Here are the details:
Remarks
Overall, you have displayed a good understanding of the topic. You have performed the assigned task excellently. However, your work could benefit from more research.
That said, this is good work. Thanks again for your contributing your time and effort to the academy.