SteemitCryptoAcademy || Season 2, Week 6 || Elliott Wave Theory || Post By Professor @fendit || Homework Done By @preshadn
I greet you Professor @fendit and my beloved steemians, am extremely happy to participate in this week's homework task, class and lecture on Elliot Waves Theory (EWT). Meanwhile, let's go straight to the task of the day...
Task for this lecture
A) Share your understanding on this lecture by answering the following questions:
This theory's application uncovers very intense lessons in the application of most principles in following market trend prior to making trade decisions. As was thought in the class, the theory assist in identifying direction of market and trend which ascertain definitely the bullish and bearish trends of assets price, with regards to some psychological factors confining the investors in the trade.
Furthermore, Elliot found out definitely that the fluctuating psychological factor perceived in the masses which influences the up and down movement is ascribed to the waves that appears irregular at all scales of length being alike in different scales having boundless repetitive shape. This obviously exhibits a repetitive pattern of market observed overtime in innate characteristic of psychological trends that can be used in ascertaining the real trend of trade when in use.
This theory puts efforts in pointing out some imperative foundation with respect to price action and determining factors. When there is rise of the price value of an asset, it is self-explanatory that more people are found trying to market their assets for gain making purpose, and when there is drop in price value, it results to much people attempting to purchase more of such assets and smaller number of people marketing.
The theory improves and endows market plan of actions as well as stop loss identification. The theory also uses corrective and impulsive wave model to direct investor on when to go for cash out or stop loss after gains must have been made. The bullish impulsive wave pattern in which the first 5 waves are on an uptrend and the last 3-waves on the corrective wave trend, directly suggests to trader to know when to market at either on the long wave as seen in the 3rd wave or HODL and take exit position as in the 5th wave model before market corrects itself. This theory, in a constant manner, provides a trader with a quick market choice or judgement and direction as regard where to deduce analysis from as soon as he observes this patterns. The impressive thing in this context is that although on a distinct scale pattern, this pattern happen many times in a similar way.
All in all, the theory has proven that it functions more essentially and makes careful use if resources when combined with RSI and MACD twosome possess the capacity of delivering a whole data value and position of exit in trade that is perceived exclusively for EWT.
Elliot wave theory is also a market indicator which explicitly points us to the market trend being aware of the fall and rise of market trends with consideration to psychological factors influencing investors and participators in the trade hence, this theory fundamentally functions with 2 wave notions:
Impulsive wave depicts 5 waves in its trends as observed from wave 1 to 5. In order to identify a single impulsive waves, the 3rd wave at all times performs an illuminating role resulting from its long wave trend alongside 2nd wave and 4th wave playing the same directional wave pattern as well as wave 1 and 5 playing a same directional wave pattern.
- Wave 1
Within this pattern of wave, a few number of investors are perceived making investment in this market that sees the wave to be a bit bullish trend as certified by its movement. Mostly, prices are low consequently the purchase-in made by investors that also assures them to sell-off at the slitest small changes in price witnessed in order to make profits.
- Wave 2
As a result of the cash-outs were made during the little period of time when prices rise in the wave 1 pattern, a small bearish trend was attested and perceived in the 2nd wave. This too impairs asset prices in trade.
- Wave 3
The low prices perceived in the wave-2, resulted to investors buying-in into the market again exactly as was seen in 1st wave however, this time thither is a rush in investments that detects the long bullish trend in this wave pattern. This is the place we espy the long wave trend in the impulsive wave pattern.
- Wave 4
This is another comparable situation to wave-2 pattern and trend in which the long trend observed in the wave-3 resulted to investors making exit positions for profits making purpose and consequently caused inconsiderable shed off from markets and bearish trend observed in wave-4.
- Wave 5
Here is a peak at which price trends are to a great extent likely to go in the opposite direction and get corrected by itself. The small bullish trend perceived was as a result of the insignificant entry positions in wave 4 which was made subsequently to some exit positions observed in wave 3.
It is observed that in such kinda market, the best entry position is observed in wave 2, Note that the best entry position in this kind of market pattern is seen in Wave-2 the time investors or traders are certain of the market trend and also, the most excellent exit positions are at the apex of the long trend in the 3rd wave or HODL until wave 5 and without delay make exit before the market gets corrected by itself and begins to run bearish.
Triangle
The triangle pattern explicitly indicates that both volume and volatility is dropping.
Flat
Here is a location at which all of market trends points are equivalent.
Zigzag
This pattern observes pattern B constantly varying and moving in contrary direction from A and C wave pattern.
What are your thought on this theory? Why?
Each market equipments are encumbered with Pros and Cons and as regards to this, EWT is not an exception. The most important thing is to make out the best out of the tool we are Each market equipments are encumbered with Pros and Cons and as regards to this, EWT is not excepted. Very imperatively is taking full advantage of the tool we are entreating leveraging on its side. With the source or provenance of the study and its technical analysis and patterns working, the EWT is observed to be very good to be at identifying stop-loss as regards market trends at the ord of trade. EWT is a true or real tool that traders should look up to in order to checkmate their
Being aware of at what time to place Stop-Loss or track the patterns that provides future feasible occurrence of both impulsive and corrective wave pattern puts traders in an advantageous position.
It very important to take cognizance of the fact that this wave pattern in its nature appears irregular at all scales of length where it is seen to be happening many times in a similar way and at no time ending alongside similarity observed on various scales.
EWT as observed is not more specified in making attainable total and technical data for traders to be able to launch entry and exit positions in trade, but when combined with market supportive tools like RSI and MACD will be a better combination observed providing traders with exit and entry positions in the trade. Therefore, makind use of the EWT alongside this combination also makes it a more characterized by attention to detail and thoroughness of treatment and proactive indicator.
Ultimately, EWT is extremely good in foretelling market trend strength that puts traders in a position of which they can take advantage to make gain owing its position to make an offer of exit and entry positions subsequently to appropriate diligence to control the predominant price chances in trade to their advantageous positions in making profits given to its position to proffer entry and exit positions after due diligence to harness the prevailing price changes in trade to their benefit.
B. Choose a coinchart in which you were able to spot all impulse and correct waves and explain in detail what you see. Screenshots are required and make sure you name which cryptocurrency you're analyzing.
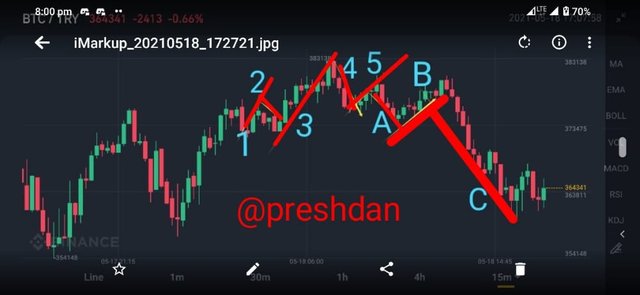
BTC/TRX Pair
Above is BTC/TRX pair market used for the purpose of analysing EWT. The trail of the market was followed when market was just a bit before the mark of 373,475, a certain number of traders were observed making entry positions into the market, giving it a few bullish trends. With some accrued gains when there was price variations, trader made exit position, this saw a bearish trend in 2nd wave.
When at wave 2 prices were seen to have dropped, more investors/traders speedily made an entry positions and this time is was more than what was observed from the entrance of wave 1, thereby leading to rush of price and long trend as observed in wave 3. Usually, when we are at the condition of being free from advantageous positions such as this, it is expected that we make some exit positions and earn good gain which are too an effect resultanting from the bearish trend observed on wave 4. These exit position in wave-3 with regard to low price witness thereafter, would without doubt allure more traders to make an entry positions which gives rise to wave 5.
Crucial Emphasis:
Little entry positions and investment exist from traders in Wave 1.
There are slight decrease of price from exit positions made in wave 1 as a result of some bullish trends observed in relation to low price in wave 2. More investors are allured by this to make stronger entry positions.
There is constantly a long trend observed from wave 3 that introduces traders to more gains from changes in price and as well more exit positions. Influential effects exists on the nearest following pattern which is wave 4.
Bearish positions are observed in the wave 4. This outline or model also is observable in the wave 2 trend pattern.
Wave 5 experienced a small bullish trend ahead of when market corrected itself.
As soon as this is observed in wave 5, the market went in the opposite direction and pull the line of a corrective wave behind as shown in the screenshot. Exactly as observed in the market trend, corrective wave A and C are observed to be following the direction and trend pattern, therefore leaving its opposite number B without a companion.
Thanks to you Professor @fendit, this is my entry