Steemit Crypto Academy Season 3- Dynamic Course for Beginners – Week 3 || Trends, Supports & Resistances and Simple Chart Patterns || By Professor @lenonmc21 || Done By @preshdan || 100% Power-Up
I am exited to be a part of this class and I want to commend Professor @lenonmc21 for his lesson and also welcome everyone on board. This week's lesson explores charts so, lets get started.
Define in your own words what a "Trend" and trend lines is and what is its function in the charts?

A trend is the general indication of the point toward which the price of an asset or market is moving. Trends, in technical analysis, are identified by trendlines or price action which emphasize when the price is making, for an uptrend, higher swing highs and higher swing lows or, for a downtrend, lower swing highs and lower swing lows.
Great aggregate of traders choose to trade in the same direction as a trend, while a financial investor who tends to have an opinion of market trends at variance with most others try to identify reversals otherwise trade against the trend. Uptrends and downtrends take place in all markets, like futures, bonds, and stocks. Trends also take place in data, like when monthly economic data increases or decreases from month to month.
- A trend is the prevalent direction of market, metric, or asset price.
- Uptrend is singled out by increasing rising data points, like higher swing highs and higher swing lows.
- Downtrends are singled out by decreasing or falling data points, like as lower swing highs and lower swing lows.
- A good number of traders choose to trade in the same direction as the trend, trying to gain from a prolongation of that trend.
- Price action, technical indicators, and trend lines are all tools that can assist identify the trend and to create awareness of impending danger when it is reversing.
With the use of diverse forms of technical analysis such as technical indicators, trendlines and price action, traders can identify a trend. For instance, trendlines may indicate the direction of a trend, at the same time the relative strength index (RSI) is designed to indicate or display the strength of a trend at any given period of time.
An uptrend is noticeable by an overall rise in price. Nothing moves straight up for long, consequently there will continually be oscillations, however the overall direction requires to be higher so as to be considered an uptrend. Recent swing lows ought to be above previous swing lows, and the same is applicable to swing highs. Once this structure begins to breakdown, the uptrend might be losing steam or going in the opposite direction into a downtrend. Downtrends are made up of lower swing highs and lower swing lows.
During the same time that the trend is up, traders may suppose it will continue till there is facts or observation that points to the contrary. Such facts or observation could include technical indicators turning bearish, the price breaking below a trend line, or lower swing lows or highs. During the same time that the trend is up, traders concentrate attention on buying, making attempt to gain from a prolonged price rise.
As soon as the trend turns down, traders concentrate attention more on selling or shorting, making attempt to make losses or profit as small as possible from the price decline. Most downtrends (not all) do go in the opposite direction at some point, for that reason, as the price keep on declining, more traders start to perceive the price as a bargain and move in to buy. This could result to the rising into view of an uptrend again.
Investors may also use trends to focus on basic analysis. This form of analysis tries to find changes in earnings, revenue, or other economic or business metrics. For instance, basic analysts may search for trends in earnings per share as well as revenue growth. Supposing that earnings have grown for the four quarters ago, this portrays a positive trend. Nevertheless, supposing earnings have moved downward for the four quarters ago, it portrays a negative trend.
Trendlines are lines able to be recognized without difficulty which traders draw on charts to join a series of prices together or display some best fit of data. The resulting line is subsequently used to provide the trader a good thought of the indication of the point toward which an investment's value might move.
A trendline is a line drawn over pivot highs or under pivot lows to indicate the predominant direction of price. Trendlines are a graphic representation of resistance and support in any given time frame. They display price direction and speed and also portray patterns during price contraction periods.
- Trendlines point out to the best fit of some data making use of a single line or curve.
- A single trendline may be applied to a chart to provide a clearer picture of the trend.
- Trendlines may be put into practical use to the highs and the lows to create a channel.
- The period of time being analyzed and the precise points used to make a trendline vary from trader to trader.
The trendline is amongst the most imperative tools used by technical analysts. In lieu of looking at previous business performance or other basis, technical analysts search for trends in action of price. A trendline aids technical analysts ascertain definitely the present direction in market prices. It is believed by technical analysts that the trend is a friend, and the first step in the process of making a favourable or beneficial trade is identifying this trend.
To make a trendline, an analyst must hold at least two points on a price chart. A few analysts like to make use of various time frames like one minute or five minutes. Others pay attention to daily charts or weekly charts. Some analysts altogether put aside time, preferring to view trends on basis of tick intervals rather than time intervals. The reason why trendlines is so universal in usage and appealing is because they can be used to help establish the identity of trends irrespective of the time frame, time period or interval used.
The trendline displays uptrend and may be thought of as support at a time of entering a position. In this case, trader can prefer enter a long position close to the trendline and at the same time extend it into the future. Supposing the trendline is breached by the price action on the downside, the trader can make use of that as a signal to close the position. This permits the trader to exit when the trend which they are following begins to weaken. These trendlines assists in identifying potential region of increased supply and demand, that can be the reason for the market to move down or up respectively
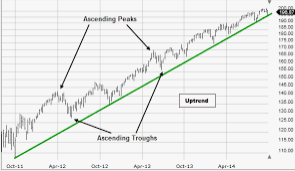
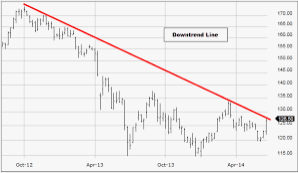
Explains how to draw an uptrend line and a downtrend line (Shows a screenshot of each).
Trend lines are levels that are used in technical analysis which can be drawn along a trend to indicate either support or resistance, in respect to the direction of the trend. It can be thought of as as the diagonal equivalent of horizontal support and resistance.
Below are guidelines on how to draw an uptrend or downtrend
- Trendline ought to be drawn from the outside of the quotes – through highs or lows. It acts as a visual support.
- Uptrend line ought to be below the quotes, and downtrend line above them. (By following this rule, one will be protected from trading against the trend).
- Trendline (uptrend or downtrend) ought not intersect with the quotes of the near past.
- Trendline (uptrend or downtrend) ought not to be drawn using the current price.
- Trendline (uptrend or downtrend) ought to be drawn using the tails of candles, not their bodies, since body of a candle might significantly vary after switching to another timeframe.
- When drawing a downtrend, draw them above the price.
- When drawing uptrend, draw them below the price.
- A trendline is determined by the highs on a downtrend and the lows on an uptrend.
 source
Uptrend
 source
Downtrend
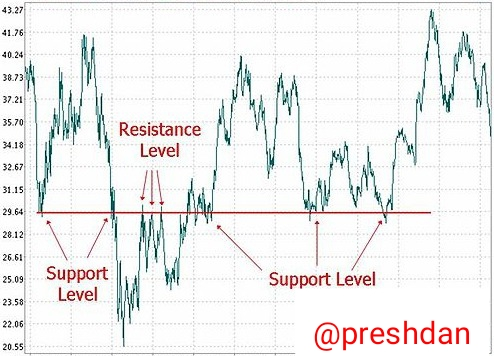
Define in your own words what are "Supports and Resistances and how we can identify both areas (Show a screenshot of each).
Support is a level of price in which a pause of downtrend can be anticipated as a result of a concentration of demand or buying interest. As assets or securities price drops, there is increase in demand for the shares, consequently forming the support line. Support refers to prices on a chart that have a tendency or disposition to act as a floor by keeping the price of an asset from being pushed downward.
A support level is a level at which the price have a tendency or disposition to find support as it falls. This implies that the price is more probable to bounce off this level rather than break through it. Nevertheless, as soon as this level is breached by the price, by an amount surpassing some noise, it is probable to continue falling till meeting another support level.
A resistance level is just the adverse of a support level. It is where the price have a tendency or disposition to find resistance as it rises. Once more, this implies that the price is more probable to bounce off this level instead of break through it. Nevertheless, as soon as this level is breached by the price, by an amount surpassing some noise, it is probable to continue falling till meeting another resistance level.
By trendlines, support and resistance levels may be identified (technical analysis). Most traders believe in making use of pivot point calculations.
The more frequent a support/resistance level is put to test (touched and bounced off by price), the more importance is given to that specific level.
Supposing price breaks past a support level, that support level frequently becomes a new resistance level. The contrary is true as well; supposing price breaks a resistance level, it will frequently find support at that level in the future.
Meanwhile, psychological Support and Resistance levels constitutes an imperative part of a trader's technical analysis. When price arrives a value ending in 50 (example 1.2050) or 00 (example 1.3000), people frequently perceive these levels as a powerful or forceful potential for interruption in the present movement. The price can hit the line and go in the opposite direction, it might waver around the level as Bulls and Bears contend for supremacy, or it can punch straight through. A trader ought to continually exercise caution when advancing nearer to 00 levels in general, and 50 levels supposing it previously has acted as Support or Resistance.
Explain in your own words at least 2 simple chart patterns with screenshots.
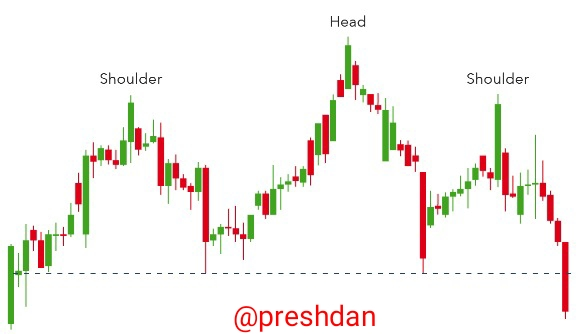
- Head and Shoulders
This is a chart pattern in which a large apex has a somewhat smaller peak on it's either sides. Traders check up on head and shoulders patterns so as to predict a bullish-to-bearish reversal.
In a typical manner, the first and third peak will be littler than the second, nevertheless they all will fall back to the same support level, in other ways known as the neckline. As soon as the third peak falls back to the support level, it is probable that it will breakout into a bearish downtrend.
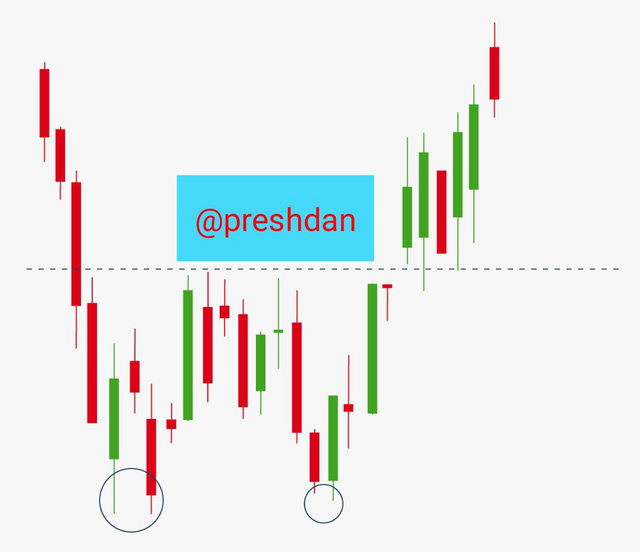
- Double Bottom
A double bottom chart pattern is a chart pattern that shows a selling period, causing the price of an asset to drop below support level. It then will rise to resistance level, before dropping again. Ultimately, the trend will turn to the opposite direction and start an upward motion as the market turn to be more bullish.
A double bottom is a bullish reversal pattern, for reason that it indicates the end of a downtrend and a move and exchange towards an uptrend.
Trendlines are used commonly by traders who seek to guarantee that the fundamental asset trend is working in favor of their position. Trendlines may be used effectively by traders to measure potential areas of support/resistance, which can assist in determining the probability that the trend will continue.
This strategic advantage is readily obtainable to any trader willing to take the time to acquire the knowledge of how to draw a fundamental trendline and blend it into their trading strategy. Although good number of traders will argue over what prices to use when making the trendline, recall that all will concur that as more prices test the support/resistance, the strength of the trendline increases.
Written by: @preshdan
I want to say a big thanks to you professor @lenonmc21 for such a drilling homework task, thanks for reading through.
Cc:.