Steem cryptocurrency:- season 2 week 6:- home work post for professor @fendit:-
Hey there this is @prakhar9675 this side and this post is against the Home work given by professor @fendit. So let's answer all the questions asked by professor @fendit

What's the application of this theory?
In this section we are supposed to write the application of Elliot theory. But before that lets have a basic understanding what Elliot theory is?
Elliot theory:- Elliot theory is named after its creator R.N. Elliot who invented this theory in 1930.
Elliot theory is a way to predict the price of cryptocurrency. As it needs graph and technical knowledge to predict the price, so it falls under the technical analysis. In this, waves(impulsive and corrective waves) are used to predict the price of a cryptocurrency.
.png)
Source
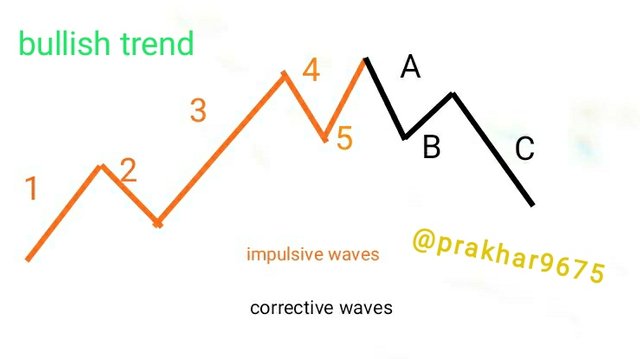
these aee the waves when market is bullish
Elliot said that market follows the same pattern over and over again. And one can see those pattern using impulsive and corrective waves. And using this one can predict the right entry and exit point into market and can minimise the risk of loosing money
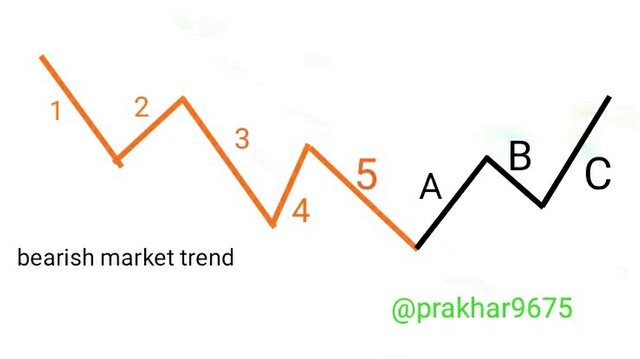
So there are 8 waves, 5 of them are in the direction of market trend known as impulsive waves and 3 of them are in the opposite side of the market trend and are called corrective waves.
So I think now you have a basic understanding of Elliot theory. So let's understand it's applications.
Avoid loss and make profit:- By looking at the pattern of the waves, and applying Elliot theory, one can determine the price is at lowest point or not. As price is lowest at the lower part of wave 1 and wave 2 never reaches at the lower part of wave 1.
So if someone has bought any asset at the lowest point of wave 1, he knows that he will always be in profit until it's second wave as it will never reaches at wave 1's lowest point.Elliot theory is ideal for any period of time:- as we earlier studied that there are many types of trading, such as scalp trading, in which Trader predict price for a very short Span of time and then buy assets and sell them in a very small period of time. And thus makes profit.
And there is holding and intraday trading. In which trade just hold any asset for a very long period and predict price for a day respectively.
.
Elliot theory is ideal for both of these. So Elliot theory can be used by scalp Trader, intraday trader both.. Predicting and forecasting price of any asset:- as we have discussed that as per this theory, market follows the same pattern over and over again so if anyone predict the future pattern of the waves by observing them in present time, then one can predict the trend of the asset or market and based on that one can forecast the price of any asset.
.
And by predicting price of any asset, one can use them for following:-
.
- • one can, by observing the pattern of the waves, determine the exact and ideal entry and exit point for the market. If one knows exactly when one has to enter or exit the market, he will never lose money.
.
2.• as Elliot theory is ideal for longer period too, so by observing the waves one can get to know whether any asset is ideal for holding for a longer period or is ideal for trading only.
What are impulse and corrective waves?
I have already gave you a brief about impulsive and corrective waves. But in this section, we will discuss these extensively.
What are impulsive waves:- These are the waves that shows the impulse of market. And these are in the direction of the market. If the market is bullish these waves will have uptrend and if the market is bearish then these waves will have downtrend and will be directed towards the bottom.
These are 5 in numbers. 3 of them are in the direction of market trend and 2 of them are opposite of it.
And there are reasons for this behaviour of impulsive waves.
this photo is edited by me in my phone so it might not be that good looking. Sorry for this trouble
For Impulsive waves, cycle starts when a group of investors invest into any asset, and it makes its price increasing. And 1st wave follows this trend as it's name suggests and thus wave 1 is in upward direction (in bullish market)
Now some investors, when asset's price increases sell a part of the asset to make profit from it. And thus it increases liquidity and hence price drops and thus wave 2 is in the opposite direction of the wave 1. But as whole assets are not being sold by anyone wave 2 never reaches at the lowest point of wave 1.
Now attracted by its increased price, other investors also started investing into that asset. And thus it price again startes increasing. As now there are more investors investing into the asset, wave 3 is in the direction of the wave 1 and the longest of all
Now again, some part of the asset is sold by investor to make profit and it pulls back its price and it makes its price decreasing again. Thus wave 5 is in the opposite direction of the wave 1 and 3 and is in the direction of wave 2
Now again, because of two consecutive highs, many other investors also see this as opportunity to make profit and invest more and it lead to its price increasing again. And it creates wave 5. As the price increases because more investors are investing into this, wave 5 is in the direction of 1 and 3
Similarly, in the bearish market, wave 1 3 and 5 are in the same direction and wage 2 and 4 are in the same direction.
Corrective waves:- As the name suggests, these are the waves that corrects the price change of any asset by increasing ( in case of bearish market trend) or by decreasing ( in case of bullish market trend) the price.
There are three corrective waves A, B and C. These three waves makes pattern such as flat, triangle, or zig Zag
.png)
Whenever there is downtrend, corrective wave A will be having uptrend and will increase the price of the asset.
When there is uptrend, corrective wave A will have downtrend and will decrease the price of the asset to correct it.
What is your opinion about this theory? Why?
According to me, this theory is quite good to predict the price of any asset and forecasting any asset's price.
There are many other theories too out there for forecasting the price, but not all of them are ideal for every period of time as some of them are ideal for long term investment and some of them are ideal for scalp trading. But Elliot theory is ideal for every period of time and one need not to master many theories if he master this.
Many people also argued there are many conditions when this theory fail, I want to tell one this. Market is volatile no one can predict that. Atleast by using this you get some idea of the market. How can only one thery predict the price of every asset, and for every period of time that too with perfection. Nothing is perfect not even this theory. But it is better than any other theory out there for forecasting price.
Choose a currency and on its chart, indicate where the full cycle of the impulse and correction waves is located. Explain in detail what you see. You must include screenshots and name which currency you are analyzing.
To indicate all Impulsive waves and corrective waves, I am choosing Ethereum and USDT pair. Here I am going to share its candlestick chart of ETH/USDT with unit time of 4 hours this means each candle you are watching is representing trading of 4 hours and at the bottom you can see the trading volume of ethereum USDT.
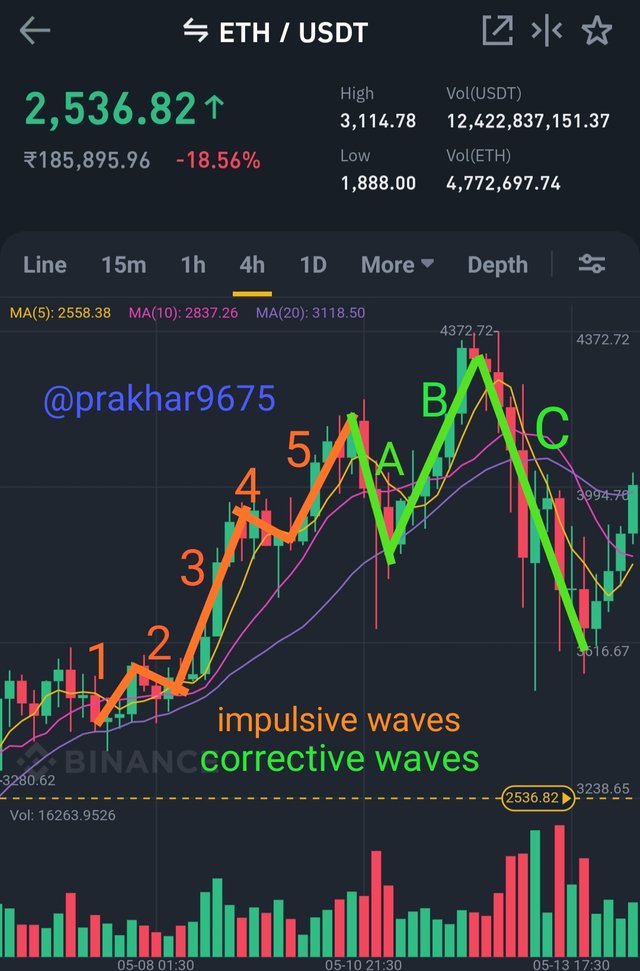
this photo is taken screenshot by me and edited using normal phone gallery. Thus it might be not good looking. Sorry for this trouble
Here you can see that when the price of ethereum was not high, some investors started investing and this led to the rise in price of ethereum and this creating impulsive wave 1. And after this price of ethereum goes up.
And at a point, when some of investors started selling it for profit, it price goes down and thus creating impulsive wave 2. As you can see wave 2 never reached at the lowest point of wave 1 thus rule is followed.
When the price of ethereum goes down, many other investors attracted towards it and invested and thus it's price went up again and thus creating impulsive wave 3. but this time as investor were in big numbers wave 3 has the highest length among all. This this rule is also followed.
When price of ethereum reaches its peak, some of investors again sold it for making profit and thus it's price again went down and created impulsive wave 4
Again when it's price was at low, many other investors invested into this to make profit and it's price again went up and touched it peak. And created impulsive wave 5.
Now this is all for impulsive waves now corrective waves came into play.
As the price of ethereum reaches very high, corrective waves came into play and corrected it's price.
As you can see corrective waves A, B and C correct the price of the ethereum and made its price nearly equal to its initial price and you can also see a huge dump into the price of the ethereum. These three corrective waves are forming zig Zag pattern to correct the price.
conclusion
Thus Elliot theory is a very good way to predict price and it's quite good to do this. Not everything is perfect so is this theory but the best thing about it is that it is applicable to all period of time and one need not to consider many other theories to predict price and one need only to master this to make predictions.
By using this one can easily avoid loss and make profit just by observing impulsive waves and corrective waves.
So that is all from my side. Hope I am understood here. Thank you.
Thank you for being part of my lecture and completing the task!
My comments:
Nicely done, explanations were really good and you could identify the pattern really good in the second task!
Overall score:
7/10
Thank you professor for your review. @fendit...