Head and Shoulders and Inverted Head and Shoulders Pattern- Steemit Crypto Academy- S5W2- Homework post for @utsavsaxena
Hey guys,
Welcome to the second week of the season 5 steemitCryptoAcademy.
Before I proceed with the given tasks, I would like to first congratulate our new professor @utsavsaxena11 for making it into the list of intermediate professors for the season. Congratulations!
Now let me proceed with the task at hand.

QUESTION 1
Explain Head and Shoulder and Inverse Head and Shoulders patterns in details with the help of real examples. What is the importance of voulme in these patterns(Screenshot needed and try to explian in details)
Before I proceed with explaining "head and shoulders and inverse head and shoulders patterns", I would like to first briefly throw light on what technical analysis is.
- TECHNICAL ANALYSIS
Technical analysis can be simply regarded as a type of market analysis which deals with the speculation of future price movements by considering the previous market data such as price and volumes.
Analyzing the market using technical analysis is majorly based on two techniques which are THE USE OF TECHNICAL INDICATORS and PRICE ACTION TECHNIQUE.
- PRICE ACTION TECHNIQUE

Price action technique is a type of technical analysis that is primarily based on the careful study of price charts and patterns in other to predict the possible price movement and direction.
This type of analysis is usually done on the candlestick chart due to its pattern of formation that allows a detailed chart analysis.
The fact that this technical analysis technique solely makes use of the price chart, makes it the basis of all technical analysis methods.
Nevertheless, the information provided by this type of technical analysis, is not always 100 percent accurate therefore it is always best to combine this trading strategy with the use of other indicators in other to maximize profit and minimize loss.
HEAD AND SHOULDERS PATTERNS
Head and Shoulder pattern is a type of technical analysis that is based on the use of "price action technique" in speculating the possible price movement of an asset.
It is a bullish trend reversal pattern that occurs by the formation of three peaks with the middle peak being referred to as the head while the other side peaks which are usually of similar height are referred to as the shoulders.
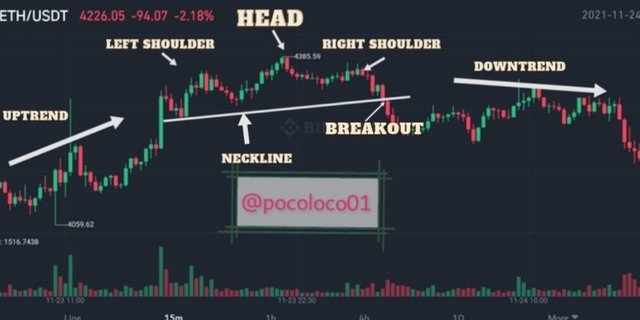
It starts with the formation of the first peak which is known as the left shoulder, after that follows the formation of another peak which rises above the initial left peak and this peak is regarded as the head.
After the reversal of the head peak, follows the formation of another peak which rises to a height similar to the left shoulder but less than the head. This third peak is regarded as the right shoulder.
It also has a neckline zone which is shown by connecting the lower ends of all the peaks. This neckline zone usually serves as a support zone during the formation of the head and shoulders pattern and afterward serves as a resistance zone after the formation.
The head and shoulder pattern help traders in speculating possible price reversal when a market has been on an uptrend.
Just as with every other analysis technique, the head and shoulder pattern is not always 100 percent accurate in predicting trend reversal therefore it is best combined with other technical analysis tools for a more accurate price prediction.
INVERSE HEAD AND SHOULDERS PATTERNS
Similar to the head and shoulders pattern but opposite, the inverse head and shoulders pattern is a trading indicator that signals a possible bearish-to-bullish trend reversal of an asset.
It starts with the formation of the first shoulder which is known as the left shoulder and after that follows the formation of the head which always forms higher than the left shoulder. After the reversal of the head follows the formation of another shoulder similar to the left but on the right side.
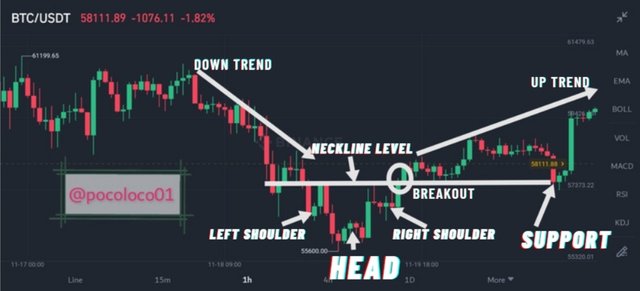
In addition, the reverse head and shoulders pattern also has a neckline which is a zone line at the base of the left shoulder and the head in a reverse manner.
Also similar to the neckline of head and shoulders pattern, the neckline of the reverse head and shoulders pattern serves as resistance during the formation of the shoulders and head and after the formation, the neckline is broken through a breakout and in turn, serves as a support for the new bullish trend.
The reverse head and shoulders pattern is one of the most efficient in predicting a possible bearish-to-bullish trend reversal although it is not always 100 percent accurate in signaling and thus should be combined with other technical analysis tools such as moving average and RSI for a more accurate price prediction.
WHAT IS THE IMPORTANCE OF VOLUME IN THESE PATTERNS
The formation of the head and shoulders does not end in the formation of the right shoulder but after the occurrence of a breakout through the neckline on side of the right shoulder.
And on this breakout through the neckline, the market volume is expected to increase.
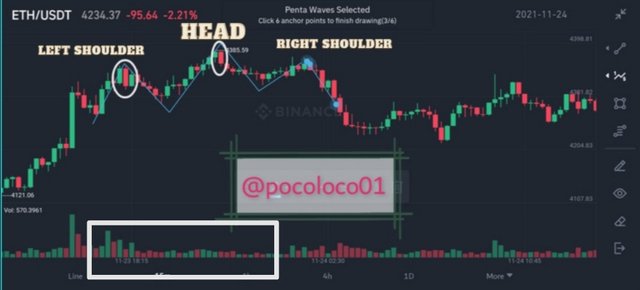
There is an increase in volume during the formation of the left shoulder which shows that buyers are still participating actively in the market and on the formation of the head, the volume reduces indicating that buyers are already being exhausted. The same decrease in volume is seen on the formation of the right shoulder which is also an indication of reduced buyers.
On the inverse head and shoulder pattern, a high volume is also seen on the formation of the left shoulder and a reduction in volume is seen on the formation of the inverted head.
Therefore having a proper understanding of volumes will easily make a trader understand when the market is in control of either buyers or sellers and the expected outcome of each effect.
- See screenshot

QUESTION 2
What is the psychology of market in Head and Shoulder pattern and in Inverse Head and Shoulder pattern (Screenshot needed)
The price movement of assets are controlled by traders emotions and this in turn affects the movement and formation of candlesticks.
Different candlestick patterns are as a result of buying and selling which of assets which are mostly influenced by fear and greed on the side of traders.
Here, I will be talking about the psychology behind the head and shoulders pattern and inverse head and shoulders pattern
PSYCHOLOGY BEHIND HEAD AND SHOULDERS PATTERN FORMATION
The head and shoulders pattern formation is a bullish-to-bearish reversal pattern. It signals a trader on when a bullish trend is already coming to an end and this, in turn, tells the trader to take a sell position.
The head and shoulders pattern starts with the formation of the left shoulder which pulls back to form the head which always has a peak higher than the left shoulder. Another pullback occurs after the formation of the head which leads to the formation of the right shoulder which is often the same size or similar to the left shoulder.
- Explanation
When there is a high volume due to overbought, the price of an asset rises to a peak which is known as the left shoulder.
Shortly after that, a pullback occurs which is a result of traders selling off mostly out of fear.
The pullback leads to the complete formation of the left shoulder. As the price gets to the base of the left shoulders, latecomers who missed out on the previous high jump in thereby causing a reversal and taking the price to a new peak which is referred to as the head.
Not long after this, the latecomers get exhausted and fear sets in which results in them selling off. This sell-off causes another pullback which leads to the complete formation of the head.
Price still at the support formed at the base of the left shoulder, makes hopeful traders jump in thereby taking the price to a new peak similar to the left shoulder. The impact of these hopeful traders doesn't last as they are only but a handful therefore the price comes crumbling down again due to the effect of short-sellers.
The price reaching the neckline leads to a complete formation of the right shoulder.

PSYCHOLOGY BEHIND INVERSE HEAD AND SHOULDERS PATTERN FORMATION
The inverse head and shoulder pattern formation is a bullish-to-bearish reversal pattern that forms to signal a possible bearish trend reversal.
This reversal pattern is one of the most used patterns in trading due to its high level of accuracy.
It forms as a result of emotions on the side of traders which I will be explaining below.
- Explanation
The reverse head and shoulders pattern form as a result of sellers pushing down the market to the point that the asset becomes oversold.
Due to this oversold, some sellers leave the market thereby making the effect of buyers be felt. This drags the price up leading to the formation of the left shoulder.
Shortly, due to the effect of stubborn sellers, the price comes pulling down again and this time even further.
This downward movement exceeds that of the first shoulder and out of fear, some sellers exit the market. The absence of these sellers makes the effect of buyers visible by the price moving up again. This reversal leads to the formation of the head.
On getting to the neckline, a handful of stubborn sellers takes control again by pushing the price down but this time not too far before getting exhausted.
This now leaves the market in the hands of buyers who thus drive the price high enough to break the neckline.
On breaking the neckline, the price fluctuates due to doubts on the minds of some traders thus making them sell. This causes a pullback thereby causing the price to retest the neckline zone.
On retesting the neckline, the exisiting sellers diminishes thereby leaving the market in full control of buyers who then causes a price reversal.


QUESTION 3
Explain 1 demo trade for Head and Shoulder and 1 demo trade for Inverse Head and shoulder pattern. Explain proper trading strategy in both patterns seperately. Explain how you identified different levels in the trades in each pattern(Screenshot needed and you can use previous price charts in this question)
HEAD AND SHOULDERS
- TREND DIRECTION
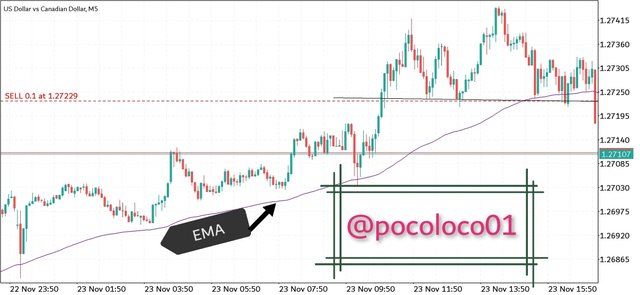
In trading head and shoulder pattern, we have to first identify the trend direction by applying trend indicators such as EMA.
The EMA is a trend indicator that identifies an overall trend direction by filtering our minor fluctuations during price movement.
The EMA identifies an uptrend by trending below the price chart and a downtrend by trending above the price chat.
IDENTIFYING HEAD AND SHOULDERS
After making sure that the market is trending up, we will move to identify the formation of head and shoulders
The left shoulder is first formed as a result of high volume. After a pullback, another peak is formed. This peak is higher than the initial one and it is referred to as the head.
After the formation of the head, another pullback takes place after which results in the formation of another peak that is lesser than the head. This peak is regarded as the right shoulder.
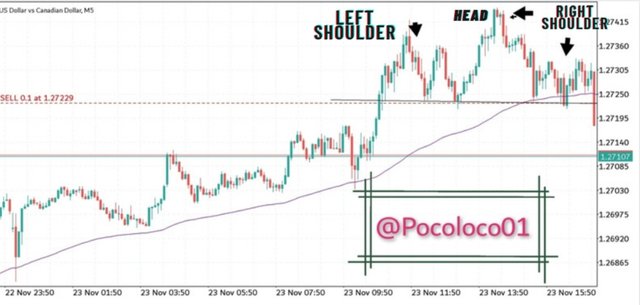
ANALYSIS
After identifying the head and shoulders, draw a neckline by connecting the lower base of the peaks with a trendline.
ENTRY POINT (Breakout)
In identifying an entry point, one will have to take note of a breakout through the neckline. This breakout occurs after the complete formation of the right shoulder.
Once the breakout occurs, a trader is expected to take a sell position in anticipation of a more continuous downtrend.
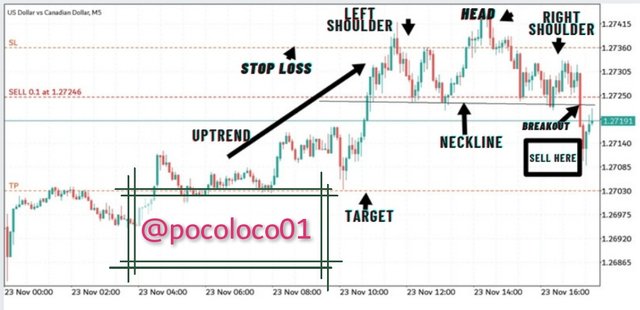
ENTRY POINT (Retest)
After the breakout, a pullback is expected to occur therefore traders who missed out on the breakout or are looking for further confirmation can wait for a pullback before taking a sell position.
This pullback which is also known as retest occurs when the price retraces back to the neckline zone before reversing again.
When this retest happens, a trader is siganalled to take a sell postion.
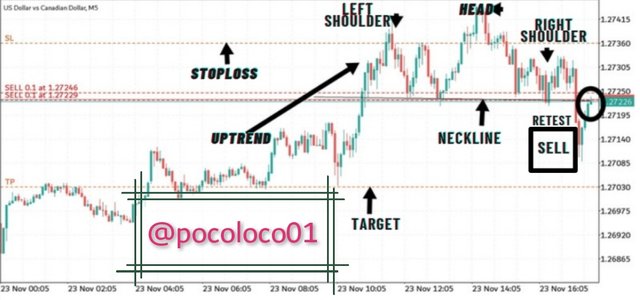
STOP-LOSS
The stop-loss is placed either at the peak of the shoulders or at the peak of the head.
It is best placed at the peak of either shoulder in other to maintain a proper risk to reward ratio.
From the screenshot above, the stop-loss is seen placed at the peak of the left shoulder.
TARGET
The target otherwise known as Take profit (TP) is set below the entry point when taking a sell position.
Taking the risk-to-reward ratio into consideration the take profit is the best set twice or three times the position of the stop-loss ie a ratio of 1:2 or 1:3.
I took a risk-to-reward ratio of 1:2.
You can also find a target by taking the difference between the head peak and the base of either shoulder and afterward subtracting this difference from the neckline.
- Practically
Considering the chart above:
| PARTS | FIGURES |
|---|---|
| Head peak | 1.27422 |
| The base of shoulders | 1.27226 |
| Neckline | 1.27226 |
Using the formular;
TP=Neckline-(Head peak - Shoulder base)
TP=1.27226-(1.27422-1.27226)
TP=1.27226-0.00196
TP= 1.27030
RESULT
After setting the TP, I'm now to monitor the trade in other to be sure it's going as speculated.
The trade went exactly as speculated.
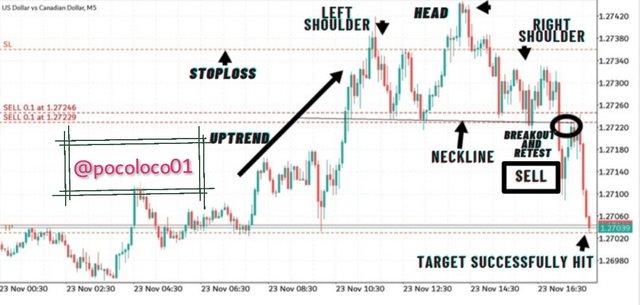

REVERSE HEAD AND SHOULDERS
TREND DIRECTION
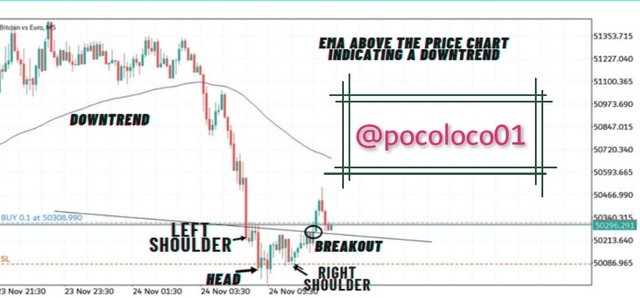
In trading reverse head and shoulders pattern, I will first make sure that the initial trend has been on the bearish side before waiting for the formation of reverse head and shoulders which will signal a bearish-to-bullish trend reversal.
In other to confirm the overall direction of the trend, I will apply an EMA on the price chart in other to make obvious the trend direction by filtering out minor fluctuations.
IDENTIFYING REVERSE HEAD AND SHOULDERS
After identifying the trend direction, I will move to identify the formation of a reverse head and shoulders pattern.
During the formation, the left shoulder forms first then followed by the head before the right shoulder.
After the complete formation of the right shoulder, I drew a neckline using a trendline by joining the base point of the shoulders.
ANALYSIS
After the formation of the reverse head and shoulders, I will wait for an entry point.
ENTRY POINT(Breakout)
Here, I will have to wait for a breakout throught the neckline in other to take a buy position.
ENTRY POINT(Retest)
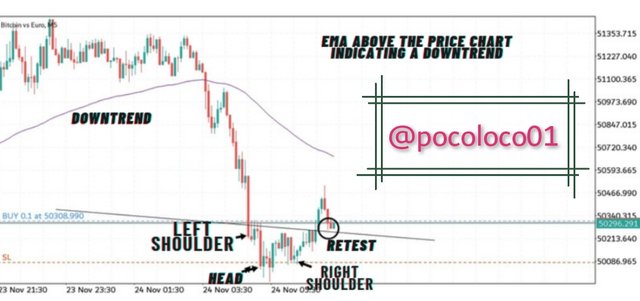
Retest which can also be considered as a pullback occurs after the breakout.
This happens when the price pulls back to the neckline zone before reversing again to continue in an upward direction.
STOPLOSS
Similar to the head and shoulders pattern, the stop-loss is set at either the peak of the head or the high point of either shoulder.
It is best set at the high point of either shoulder in other to achieve proper risk management.
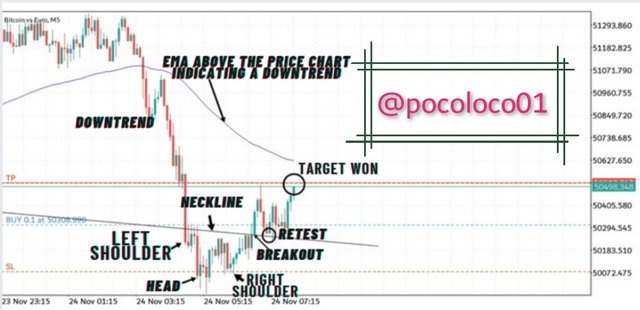
TARGET POINT
The target point is calculated by taking the difference between the peak of the head and the high point of the shoulders and then adding the figure to the neckline.
- practically
Below are the figures from the price chart above.
| PARTS | VALUES |
|---|---|
| Head | 49999 |
| Shoulder high | 50258 |
| Neckline | 50258 |
Using the formula;
TP = Neckline + (Shoulder high - Head peak)
TP = 50256 + (50258 - 49999)
TP = 50256 + 259
TP = 50515
RESULT
After setting the TP, I monitored the trade in other to be sure it is going as speculated.
The trade went exactly I predicted.

RESULT OF BOTH TRADES
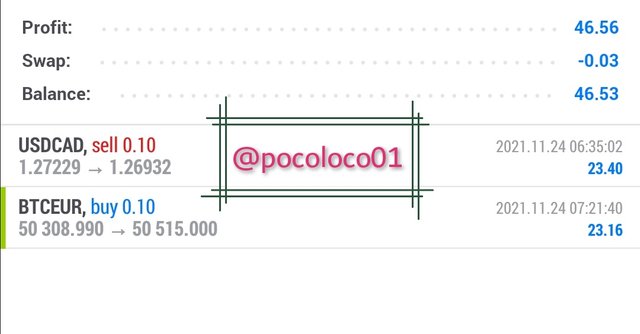
The two trades initiated using the head and shoulders and inverse head and shoulders patterns, went exactly as speculated and successfully touched the targetted points.

QUESTION 4
. Place 1 real trade for Head and Shoulder(atleast $10) OR 1 trade for Inverse Head and Shoulder pattern(atleast $10) in your verified exchange account. Explain proper trading strategy and provide screenshots of price chart at the entry and at the end of trade also provide screenshot of trade details.(Screenshot needed.)
I will be performing this task using my verified Binance exchange account.
I started with opening my Binance exchange account in search of a trading pair. I took me quite some time before I found the formation of the inverted head and shoulders pattern on a 5 minutes chart of CHESS|USDT pair.
I waited for a complete formation of the pattern before drawing my neckline by connecting the high of the left shoulder with the high of the inverted head with a trend line.
After drawing my trend line, I waited for a breakout before taking a buy position.
- See screenshot
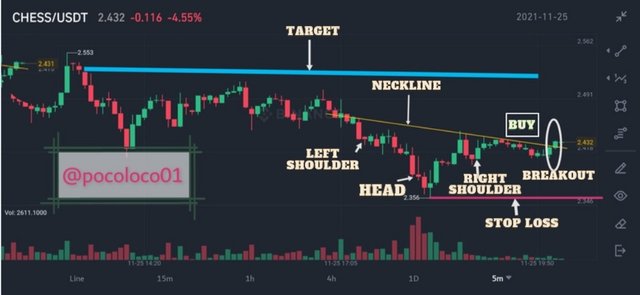
I took the position of a market taker by initiating a buy order at the current market price and with my $11.664 capital, I was only able to purchase 4.8 pieces of $Chess token at $2.43 per 1.
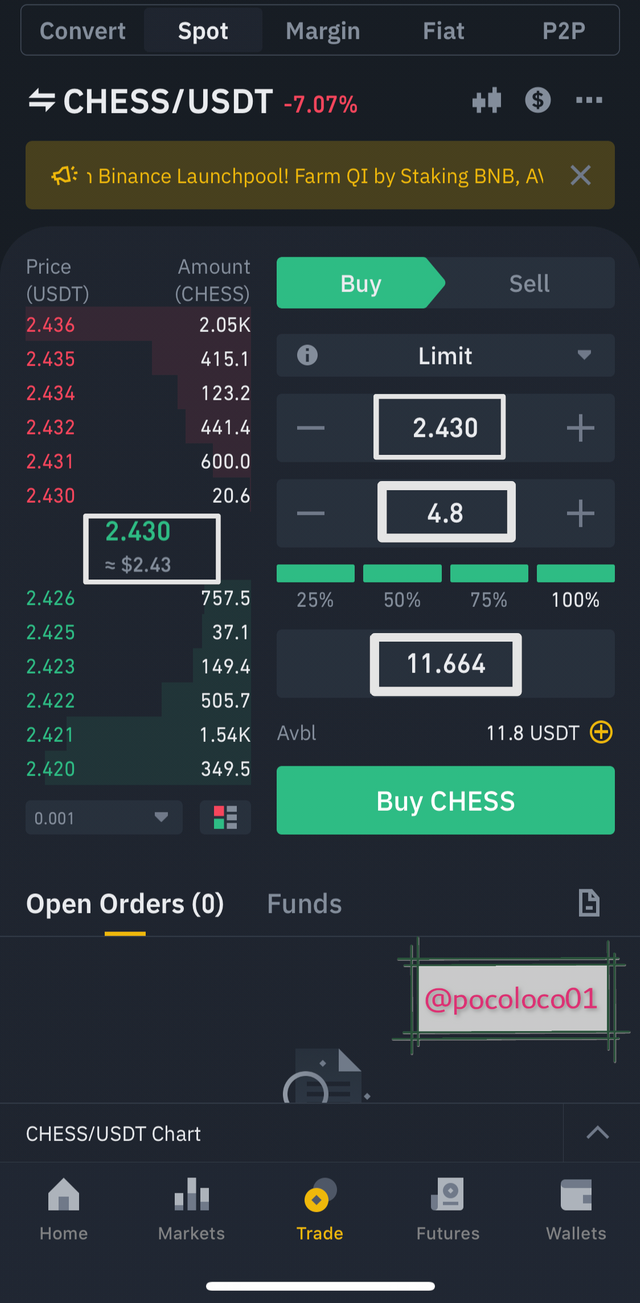
screenshot from Binance exchange
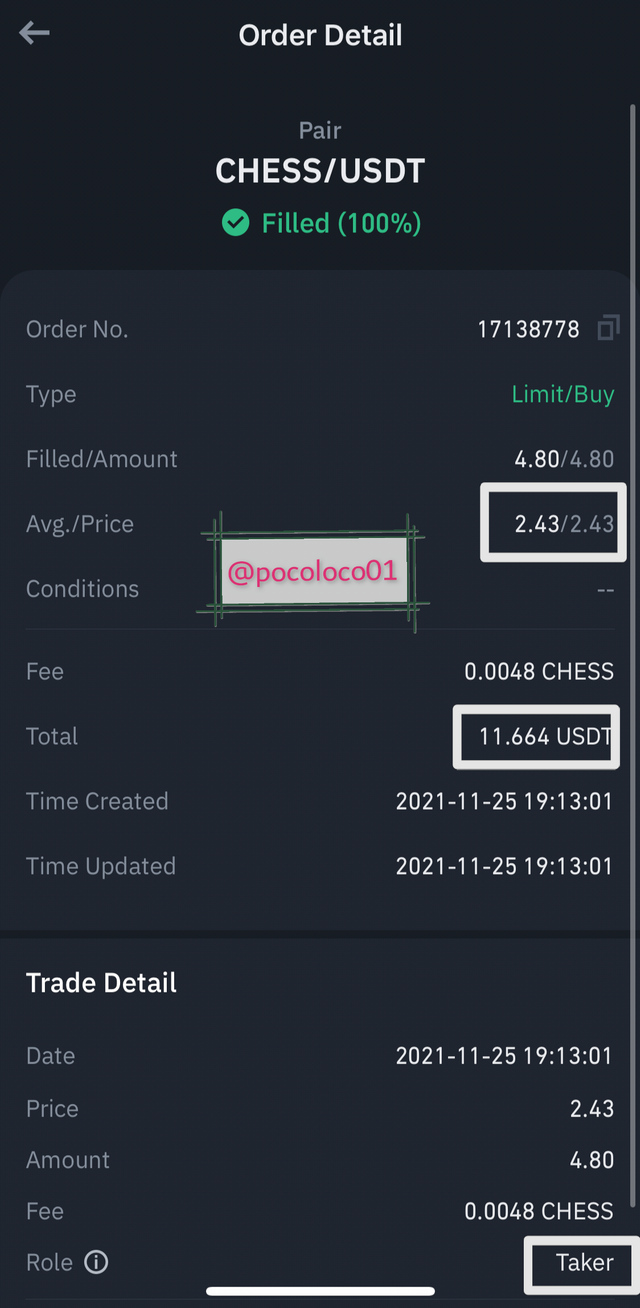
screenshot from Binance exchange
After placing my order, I moved to mark my stop-loss and target
STOP-LOSS
The stop-loss is either set at the peak of the inverted head or the peak of the inverted shoulder.
I choose to set my stop-loss at the inverse peak of the head due to the high probability of the price touching the inverse peak of the shoulder before properly reversing.
Although, stop-loss is best set at the peak of either shoulder in other to ensure proper risk management.
TARGEt (TP)
I calculated my target by taking the difference between the peak of the inverse head and the high of the inverse shoulder. I then added the difference to the value of the neckline which now gave me the supposed value of my target.
- Data
| PARTS | FIGURES |
|---|---|
| Inverted head peak | 2.356 |
| High of the shoulder | 2.442 |
| Neckline | 2.442 |
- calculation of Tp
In calculating TP, I normally use a formula that I believe summarizes the whole above explanation.
In calculating the TP for inverted head and shoulder pattern we have,
TP = Neckline + (Shoulder high - Inverted head)
TP = 2.442 + (2.442 - 2.356)
TP = 2.442 + 0.086
TP = 2.528 point
After marking my stop-loss and target, I monitored the fluctuating price movement of the asset before it finally touched my tp.
- screenshot
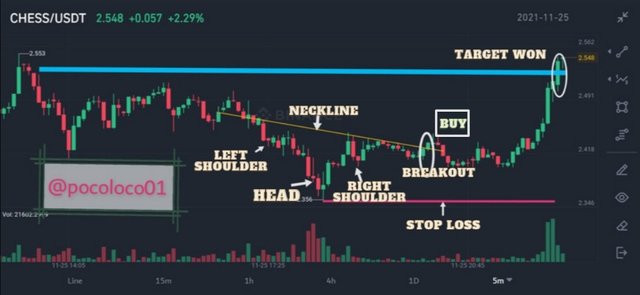
After the price touched my TP, I went back to my spot account and sold the 4.8 pieces of $Chess token which I initially bought with $11.664 for $12 USDT thereby making a little profit.
- Screenshot
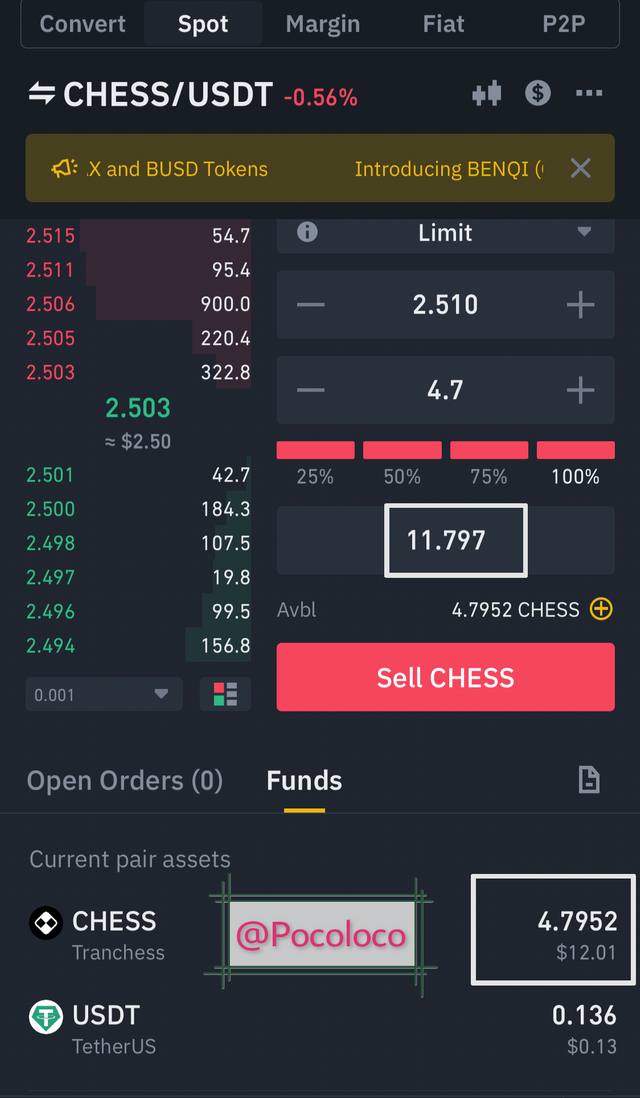
The profit is small because the trade was performed using a spot account but profit is profit and I am grateful.

CONCLUSION
The head and shoulders and inverse head and shoulders pattern is one of if not the most accurate reversal patterns. Its level of accuracy makes it one of the most used in the financial market.
It signals a trader on when a price trend is weak and prone to a possible reversal and this, in turn, helps a trader to take a proper position.
Just like every other pattern, the head and shoulders and inverse head and shoulders pattern formation are solely dependent on traders' psychology.
Nevertheless, as no trading pattern is perfect, it is best advised to combine this trading pattern with other technical analysis tools for a more accurate result.
Special regards to professor @utsavsaxena for this wonderful lecture. I enjoyed it.