Trends - Crypto Academy/ S5W1- Homework Post for @reminiscence01.
1a) What do you understand by a Trending market?
b) What is a bullish and bearish trend? (Screenshot required).
a) Trending markets are the kinds of financial markets where the price is generally moving in one direction. Such movement can either be upwards which is referred to as an Uptrend or movement can be downwards which can be referred to as the Downtrend. In the Uptrend prices close at a higher high than the highest lows. In the Downtrend prices close and a lower low than than the high lows.
Trending markets are useful to traders who know how to interpret them because all they have to do is follow the trend. Following the trend helps traders make the utmost profits as they catch every swing however they have to be knowledgeable to know when to close up their positions to prevent making losses. Markets can have trends for both short and long periods of time however, one has to notice that trends have to happens continuously for a long period of time for maximum impact.
b)One has to bear in mind that trends on financial markets are dtermined by forces of demand and supply. Where there is limited supply and high demand, a bullish trend will occur. In instances where there is a high supply and limited demand for a commodity on the financial market then a bearish trend will occur. The buillish trend is the kind of trend in the financial market where the prices are continuously rising. Basically an upward trend takes places. This happens when financial commodities cryptocurrency inclusive have their prices rising. In such a trend most traders are buying a financial commodity and therefore causing it to be scarce on the market thus increasing in value which pushes the price upwards.
One has to notice that even though prices may fluctuate in the bullish trend, the price normally closes at a higher price than the lowest high.
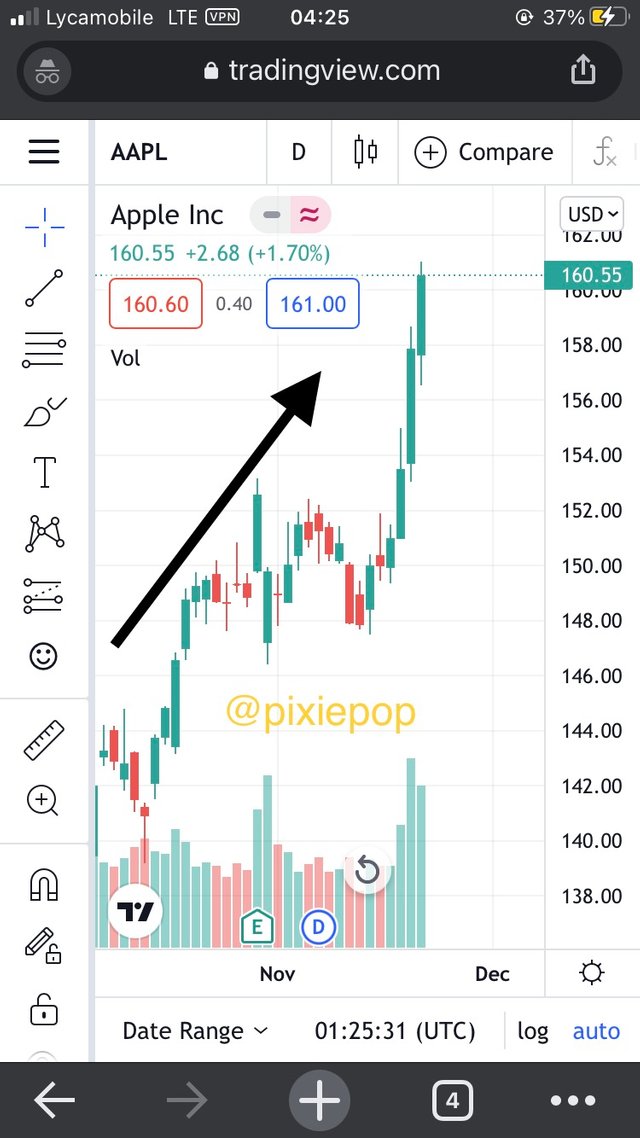
Above is an APPLE shares chart showing a trending market upwards thus expressing the bearish trend.
The bearish trend on the other hand is a downward trend where the prices keep falling continuously. This happens when a financial commodity is losing value therefore causing its price to fall. In this case, there is excess supply on the financial market therefore having more sellers than buyers.
Here, price series tend to close at the lowest low than the lowest high.
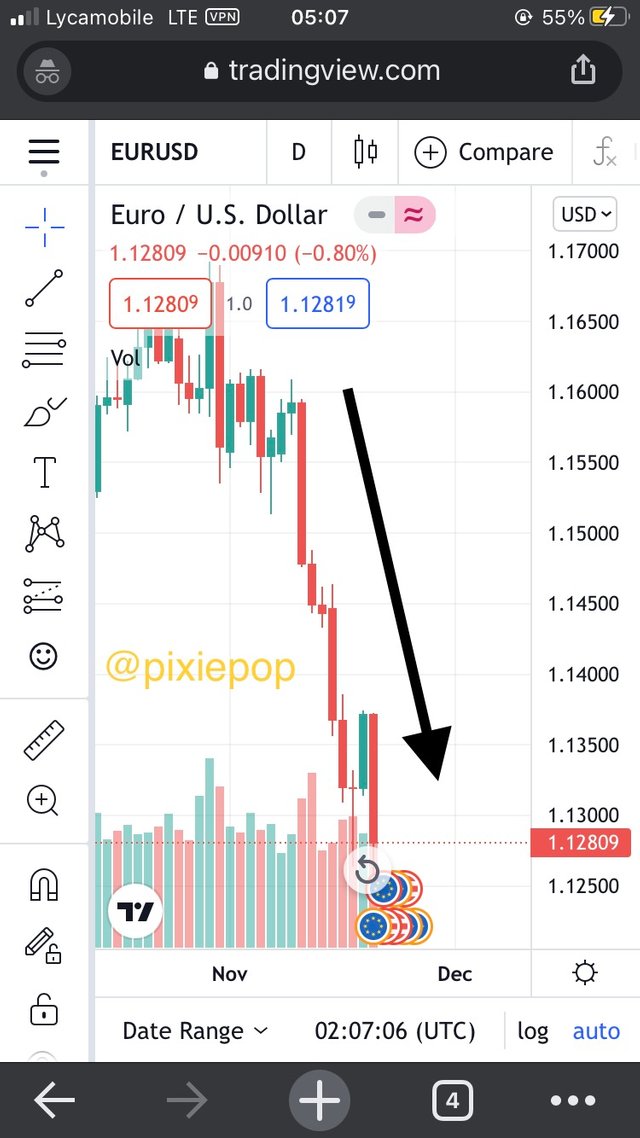
Above is a EURUSD chart with a bearish trend.
2) Explain the following trend identification and give an example of each of them. (Original screenshot needed from your chart). Do this for a bullish and a bearish trend.
i) Market Structure.
Market Structure is useful in the sense that it shows the current state of the financial market. It does this by showing whether the market is in an uptrend or a downtrend. It also clearly shows when the market is raging, as in this state there will be no particular trend rather just points of support and resistance.
Candlestick charts clearly help a trader see patterns and they can interpret for themselves which is trend is happening.
The market structure is different for both the bearish and bullish trends. In the bearish trend the market structure forms both lower highs and lower lows. Basically, the price does not close above the previous low high rather it closes at a price lower than it. The price literally breaks the previous lowest price and goes lower. This is a signal for that the downtrend is continuing.
The downward trend continues forming lower highs and lows however if sellers can’t push it any more then the trend weakens and will most likely be heading for a reversal. The signal to look out for to anticipate a reversal would be when the price goes higher than the lower high.
In the bullish trend the market structure is characterized by higher highs and higher lows. Prices not go below the previous high point as the price keeps rising. The price normally closes above the higher high. This signifies presence of buyers in the market who keep pushing the price high continuously. However, the weakens at the point where the price falls below the high low. Then one can anticipate a reversal occurring.
One has to keep in mind that fluctuations and retracements occur and a trader has to look for pullbacks as those would be the perfect entry positions to take advantage of the bullish trend.
In ranging markets, there is no particular trend rather the market is characterized by prices bouncing off the support and resistance areas. Traders can trade in such markets however at this point trend traders do not trade. Rather they are aware that this phase is normally for accumulation where they close their positions and take their profits or they prepare for build up for a trend.
Traders that trade in ranging markets normally sell at resistance and buy at support areas. Ranging markets normally don’t have new lows or new highs.
ii) Trendlines.
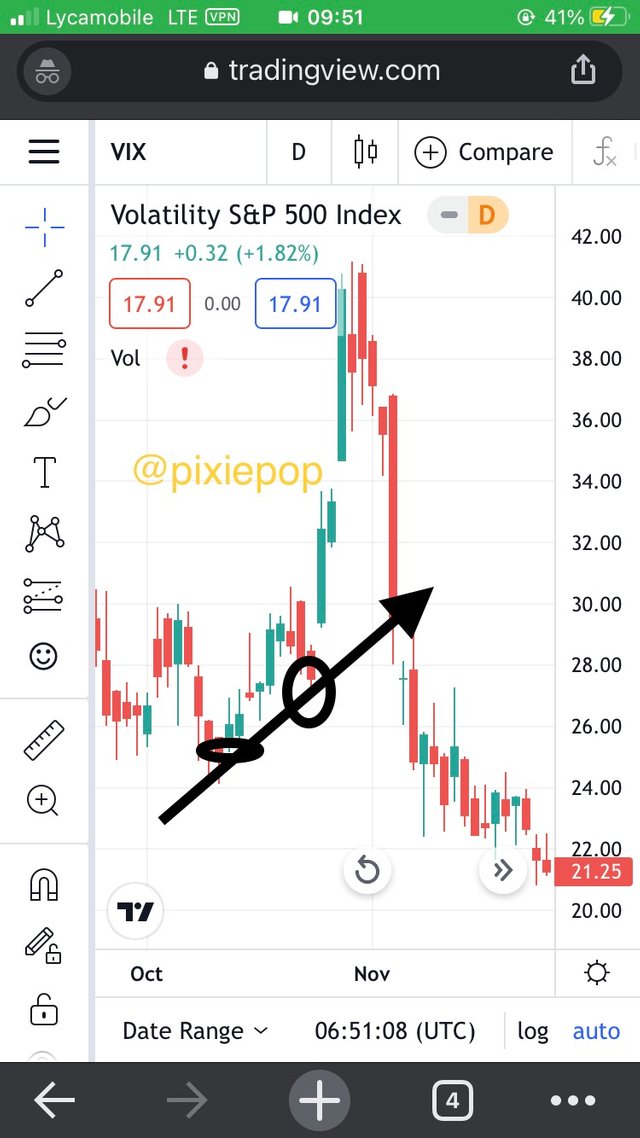
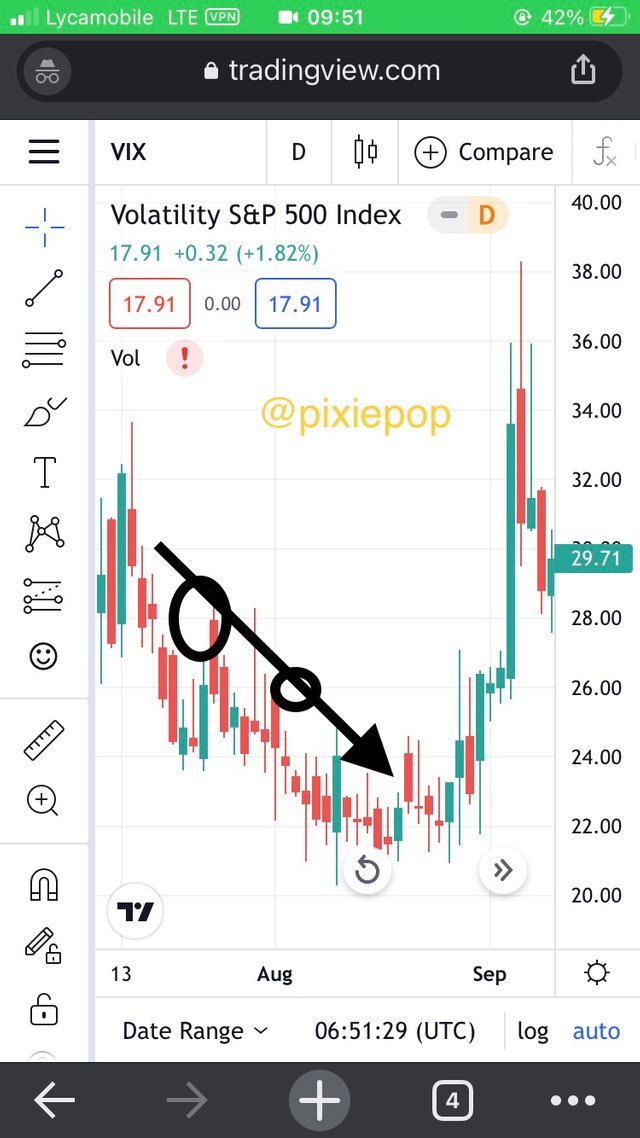
Trendlines are also a technical analysis tool used in identifying trends. Trendlines point towards the direction of the market by showing where the trend is going. To ascertain an uptrend one has to mark two low points on the chart. For a downtrend one has to mark two high points to ascertain the direction of the trend.
In the bullish trend price trading is above the two low points marked on the graph. Each time the price hits the trend line it bounces back up which shows the strength of the buyers in the market.
On the other hand, the bearish trend the price trending is normally below the trend line. The trend line acts as a resistance as the price does not go above the trend line as bounces back below it.
3) Explain trend continuation and how to spot them using market structure and trendlines. (Screenshot needed). Do this for both bullish and bearish trends.
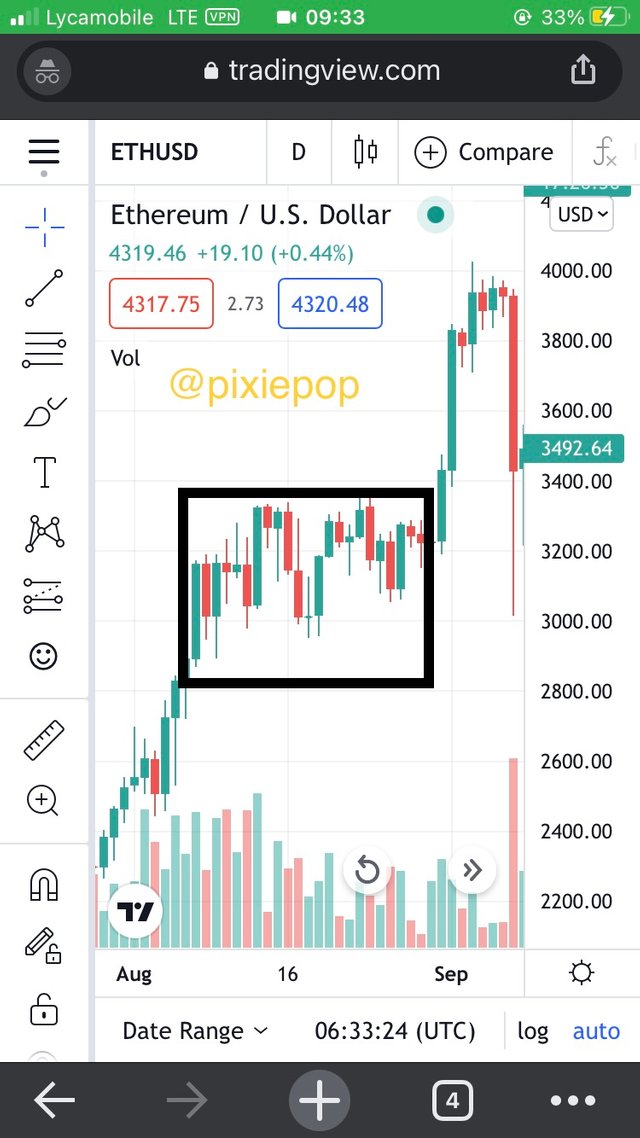
Trending markets have retrecements and fluctuations as the price movement is not in a straight line. On charts like candlesticks charts the price movement is normally in a zig zag movement. In bullish trends, normally after a strong bullish reign breaks price normally comes back down to test the resistance and rises again to continue with the trend.
On such points where the price retraces, it means traders are taking their profits to enable the price proceed in its original direction. One needs to understand trend continuation because it is very useful in knowing whether the trend will continue or retrace so that a trader can know whether to close their trade positions or not. The pullbacks are useful in the sense that they can act as new entry points so traders can benefit from the trend be it bullish or bearish.
Market structure as we discussed earlier is useful in predicting trends and knowing the direction of the market. Upward trending markets are characterized by higher high and higher lows. Usually after high move, price movement may retrace for the price to move back to its original position.
In the bearish trend there are usually lower highs and lower lows. Some of the ways one can tell that such a trend is going to be reversed or change is by;
i) Noticing when the high point during retracement goes below the previous low point. If this happens then one can anticipate a reversal.
ii)Noticing that the new low point created in i) must be lower than the previous low point.
In the bullish trend, one has to look out for the following;
i) One has to notice when the new low point is lower than the previous low.
ii) The new high point should be higher than the previous high point.
When any of the points mentioned above happen it shows that the trends are weakening and that there is a likelihood of trend reversal. Usually the price fails to create a new high in the bullish trend and for the bearish trend, the price movement fails to create a new low. These signals are useful in the sense that they inform the trader when to close their trade positions and bag their profits. On the other hand they also signify new entry positions for traders for the next trend.
Trendlines are also useful in showing the direction the market is taking. The trend line is useful in the sense that it acts as a support and resistance during the trend market. This is expressed in the sense that during trending markets prices back towards the trend line. The price does not go below the trend line. During the downward trend, the price movement does not go above the trend line.
4) Pick up any crypto-asset chart and answer the following questions-
i) Is the market trending?
ii) What is the current market trend?
(Use the chart to back up your answers).
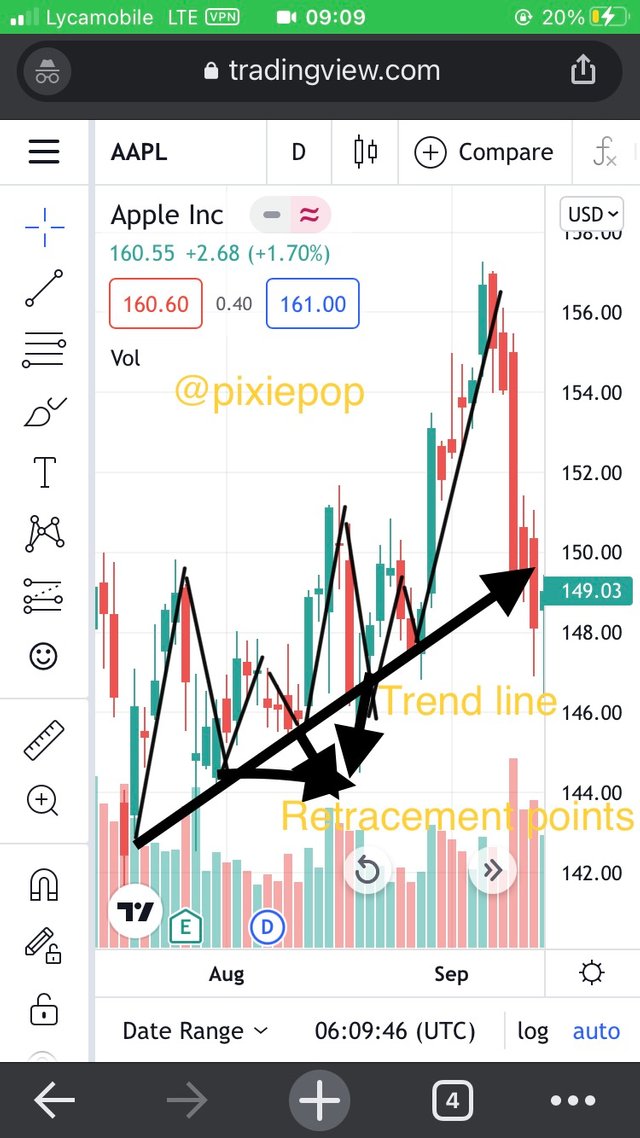
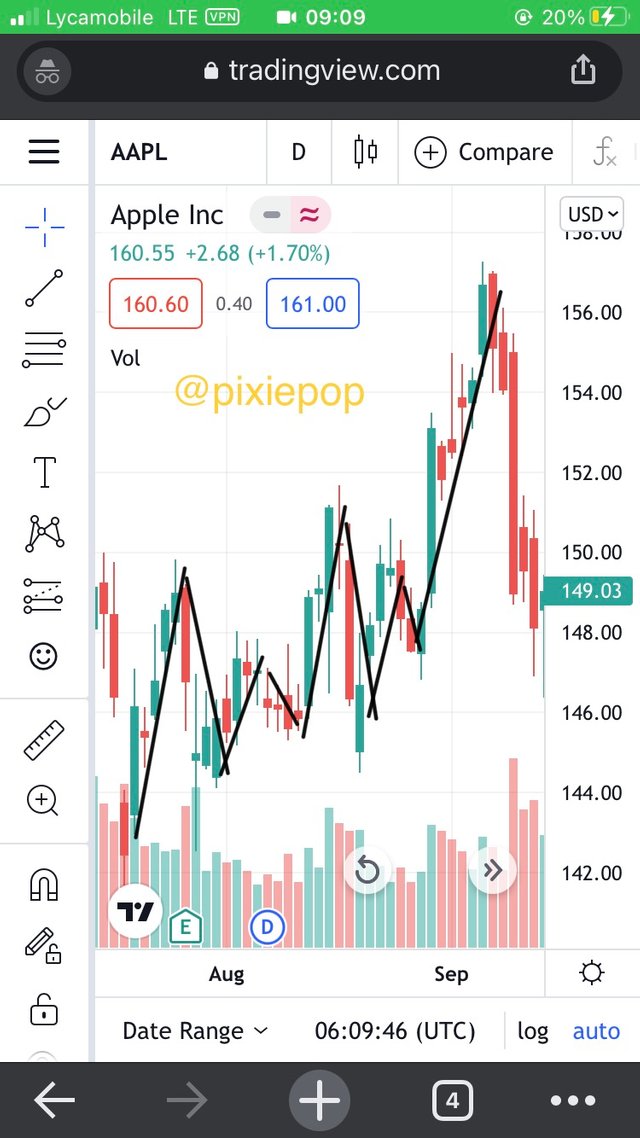
The chart above is for Apple shares and reflects a bullish trend. We notice that the price movement keeps creating higher highs and higher lows. We notice that the Apple shares hit an all time high of 156k however the retraces to a low of 150k. We also notice that even though the price movement is retracing, the price movement has not gone below the highest low therefore we anticipate that the upward trend is likely to continue.
This would therefore be a good entry point for traders that would like to utilize the next reign of the upward trend.
However, a trader has to be sure that before they close their trading positions that the trend has failed to create any new highs.
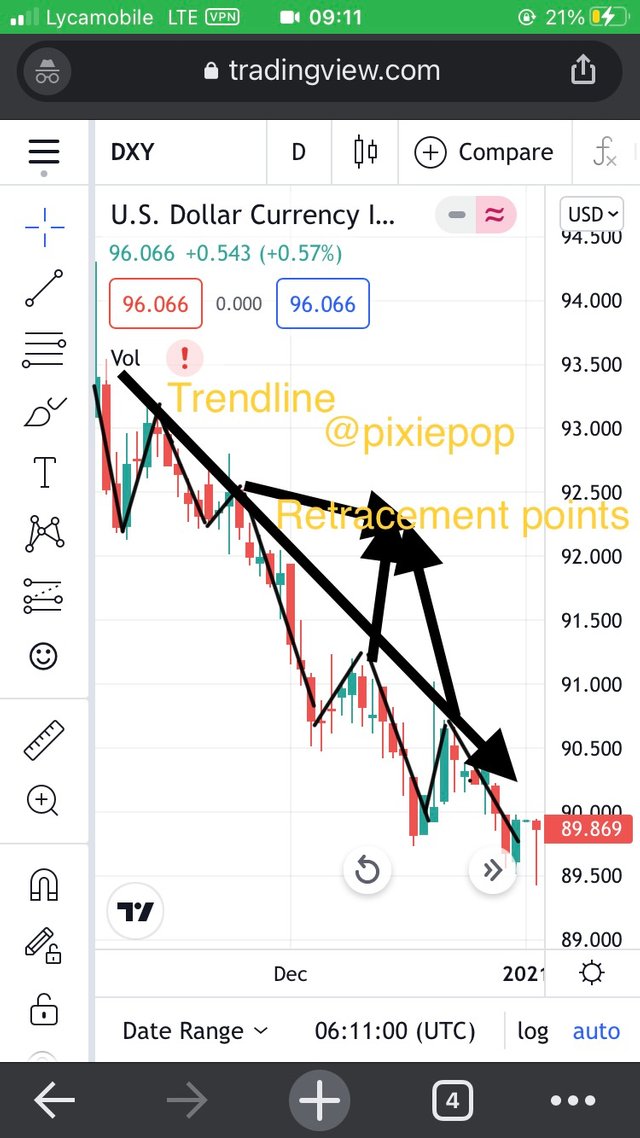
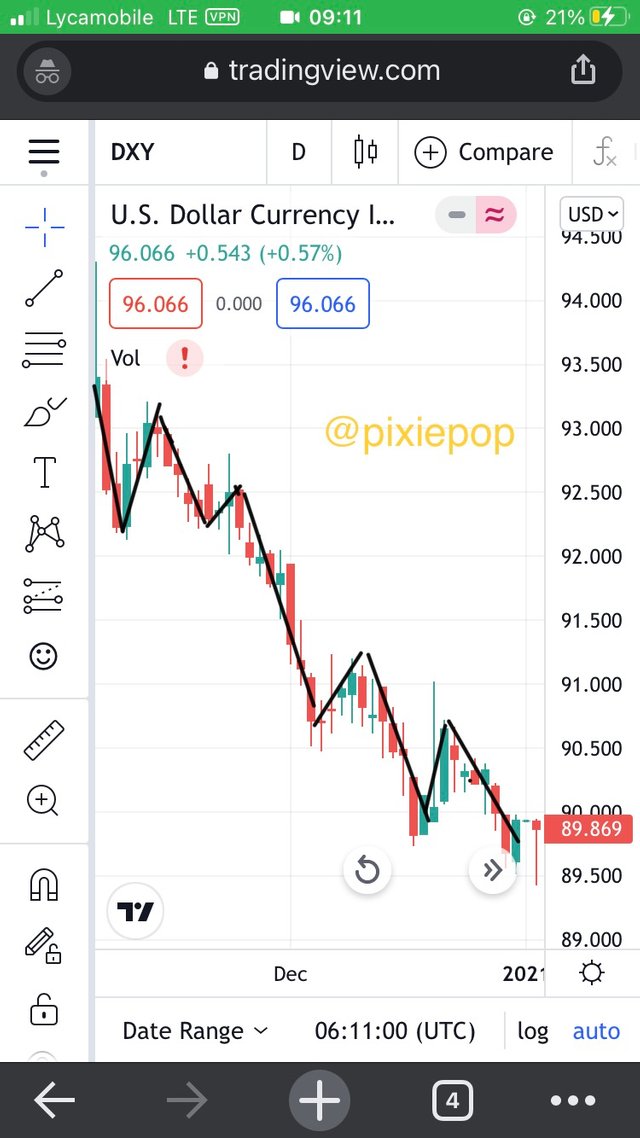
Above is the DXY chart which is expressing a bearish trend. We notice that the price movement has hit an all time new low of 89.869 from 92k. Therefore the price has gone below the lowest low then we expect that the price movement is likely to retrace unless new lower lows are created.
5) Conclusion.
We have looked at trends in financial markets and how they are to be identified and what they signify. This knowledge is very useful because it helps us as traders to know when to enter the market and when to close our trading positions in the market to prevent making losses. To fully utilize use of Market structure and trendlines we have to use them with other technical analysis tools to get more accurate results.
Hello @pixiepop , I’m glad you participated in the 1st week Season 5 of the Beginner’s class at the Steemit Crypto Academy. Your grades in this task are as follows:
Recommendation / Feedback:
Thank you for submitting your homework task.
You have been curated by @yohan2on, a country representative (Uganda). We are curating using the steemcurator04 curator account to support steemians in Africa.
Always follow @ steemitblog for updates on steemit