Steemit Crypto Academy Season 3 Week 2 - Beginner’s Course| Introduction to Charts.
A chart in simple terms is a graphical representation of the price of a commodity though it can have other derivatives to.
A Japanese candlestick chart is a graphical representation of the price of an asset indicated by candlesticks arranged following the actual movement of the price of an asset in a specified
period.
The Japanese candlestick chart shows using a graph the interaction of buyers and sellers on the market thereby showing the different prices at the different points of the interaction.
This chart is really ancient as it was developed in the 1700s by a Japanese rice trader called Munehisa Homma.
The Japanese candle chart is made up of candles and the candles have the;** open**, high, closeand low prices on it.It also has the real body on which all those other points are attached.
Open shows the start of the price movement. Normally that would be the part where one could read from the starting price.
High shows the highest price of the commodity recorded within a specified period.
Close depicts the last price recorded on the candle.
Low shows the lowest price recorded within a specified time.

Image Source
Above is an image of a Japanese candlestick chart.
Generally all charts show movement of price in a certain direction in a specified time. Apart from the candlestick chart, there are other types of charts that include bar, line, rank and volume charts.
Line charts
A line chart is a graphical representation of an asset’s historical price action that connects a series of data points with a continuous line.Souce
This is the most basic chart in finance and it is really good for tracking day to day price changes.
Furthermore, it is really easy to understand because it mostly depicts changes in assets’ closing price over time.

However some people prefer the other types like the candlestick chart because it is more detailed unlike the line chart that focuses so much on the closing price and may leave out details like low, and high prices.
Bar chart
A bar chart is a collection of bars each illustrating how the price of an asset moved over a specified period of time. Each bar shows open, high, low and close prices.
This chart has the vertical and horizontal lines however the information is represented through bars on those lines.

The bar chart is useful in analyzing trends, spotting trend reversals. It helps in monitoring price movement and volatility.
If on the vertical line the price bar shows such a huge difference between the high and low prices then that shows that the volatility is high unlike when the difference is not so huge showing low volatility.
The Japanese candlestick chart is mostly used by traders because;
1) It is detailed in the sense that one is able to get all the prices i.e low, high, close and open which is not possible when using some charts like the line chart.
2) It enables traders know which side is in control within a certain period either the buyers or the sellers. This is helpful because it helps the traders make the right decision coming from an informed point of view.
3) Furthermore, the candlestick chart can be used alone though can even give better results if used with other technical tools.

Bullish candle
This form of representation shows an appreciatiom in the price of a commodity.
Here the closing price settles above the opening price which means that the price moved upward at a given time.
The continuous formation of this kind of candle stick is what is referred to as the bullish trend.
This is useful to traders because this is the time that they get to sell the asset or commodity to earn a profit.

Image Source
Above is a Japanese candle stick chart showing the bullish trend.
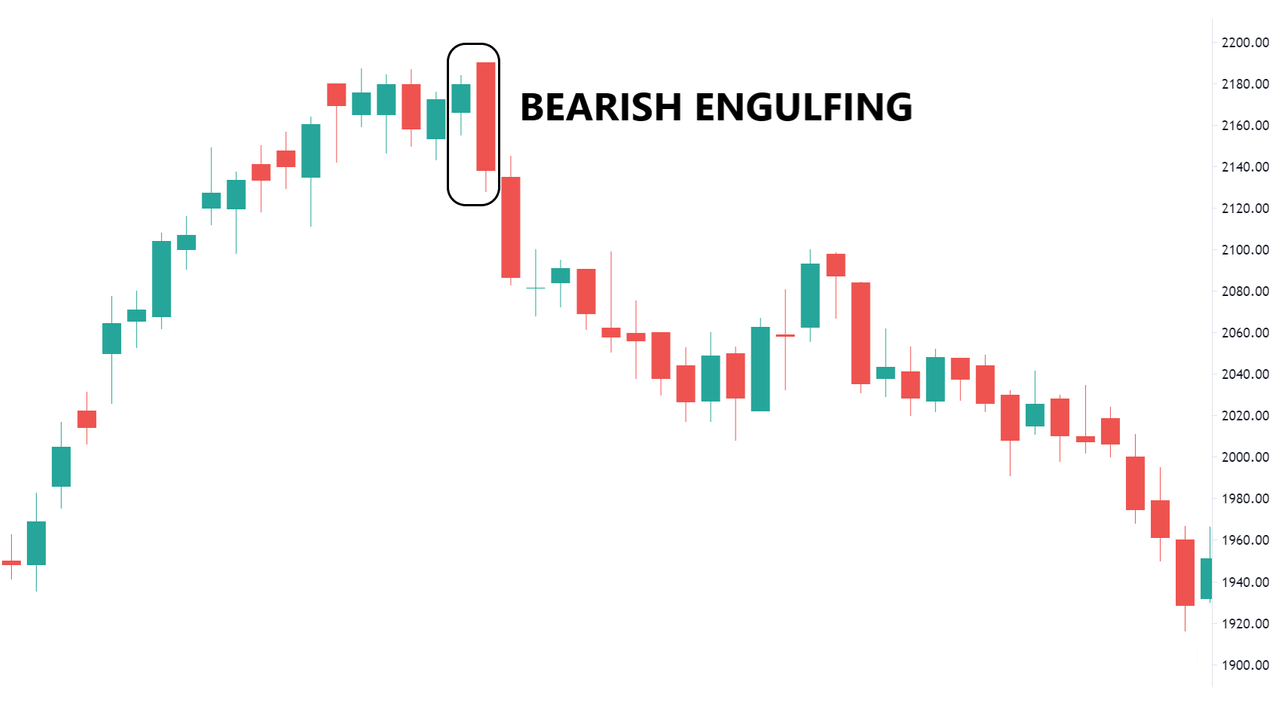
Bearish candle
This form of representation shows decrease in the price of an asset.
This is the opposite of the bullish candle as here the close price is below the open price.
Normally here traders buy the asset and wait till it increases in value to sell.
The continuous movement of candles in this trend is what is referred to as the bearish trend.
@reminiscence01-s3week2
References
You have been curated by @yohan2on, a country representative (Uganda). We are curating using the steemcurator04 curator account to support steemians in Africa.
Keep creating good content on Steemit.
Always follow @ steemitblog for updates on steemit