Crypto Academy/ Season 3/ Week 8 - Intermediate : Crypto Assets and the Random Index (KDJ).
1) In your own words define the random index and explain how it is calculated.
Random Index also known as KDJ indicator is a technical indicator used for technical analysis to observe changes in price movements, trend reversals, good market entry and exit points. This indicator is said to be inspired by theStochastic Oscillator because they have similar lines. However, the two are differentiated by the fact that Random Index has a J line which is absent in Stochastic oscillator.
Random Index is referred to as KDJ indicator because it has three lines namely; K line, D line and J line. The K and D lines show when the asset when it is overbought or oversold. The J line however shows the divergence between the K and D lines.
Random Index is calculated by considering the highest, lowest and closing price on the K and D lines. The J line is formed at the points where the K and D lines meet therefore these points connect and create a pattern. Random Index is therefore calfulated basing in the pattern formed.
A signal is given when the J line converges, intercepts or crosses over the K and D lines. The overbought signal is given when the J line exceeds 70% or in extreme cases over 80% or goes above the K and D lines. In instances where the the oversold signal is given off the J line goes below 30% or 20% in extreme cases or goes below the K and D lines.
2) Is the Random Index reliable? Explain.
Random Index is able to show the value of an asset when it is overbought or oversold. It is able to show these values through the K and D lines. KDJ indicator couples this with the presence of the J line which shows the market trends by showing overbought and oversold signals when it goes either above or below the K and D lines.
Random Index is considered more accurate compared to the stochashic oscillator and alligator indicators on which it is based because it has the J line which makes predictions more accurate.
Through the KDJ line patterns one easily determine the entry and exit points in the market. It gives the signals of overbought and oversold therefore one can can know when to easily enter the market. One easily knows to buy when an oversold trend is showing and vice versa when there is an overbought trend.
However, the KDJ indicator has been reported to be inaccurate where the market is flat or where the market is ranging where prices are constantly changing from high to low. It has also proved to be inaccurate for short time analysis, therefore it is more accurate when predicting trends long term.
To solve these challenges, the KDJ indicator can be used alongside other indicators like Average True Range (ATR) and Average Directional Index (ADX) to more accurate results.
Therefore, Random Index is therefore pretty accurate compared to other indicators especially ones from which it was developed (stochastic oscillator indicator) as it has modifications that make it give more accurate results.
3) How is the Random Index added to a chart and what are the recommended parameters? (Screenshots)
One has to sign in, on the TradingView website or if one does not then they have to create a new account for themselves.

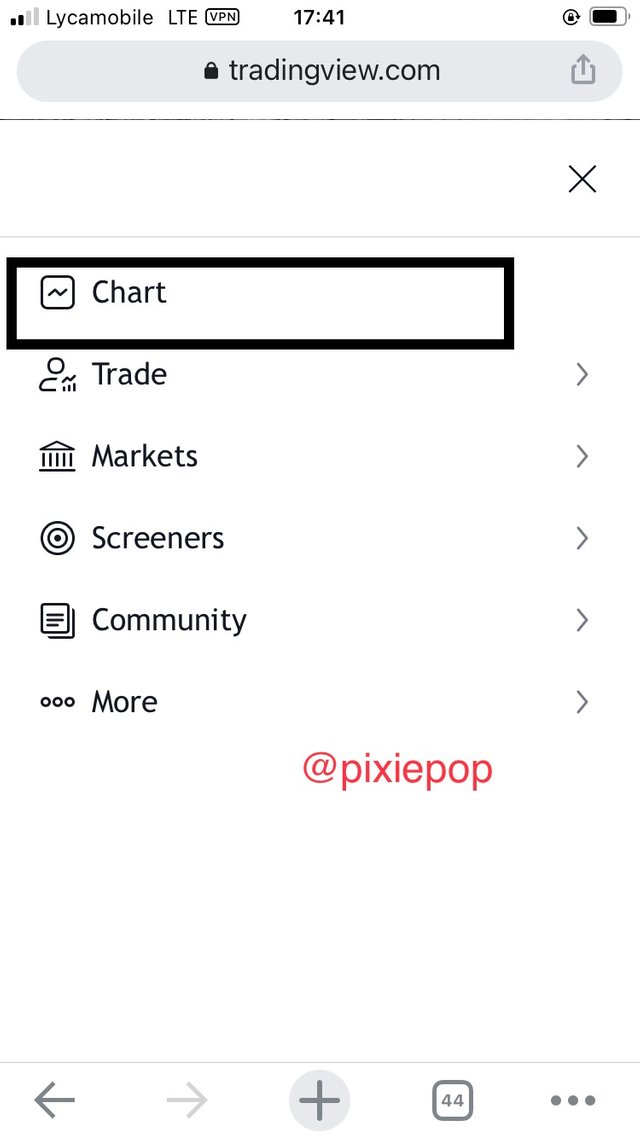
On signing in, one has to go the upper left side and click on the dashes stacked on each other to see the menu, then one has to pick charts.
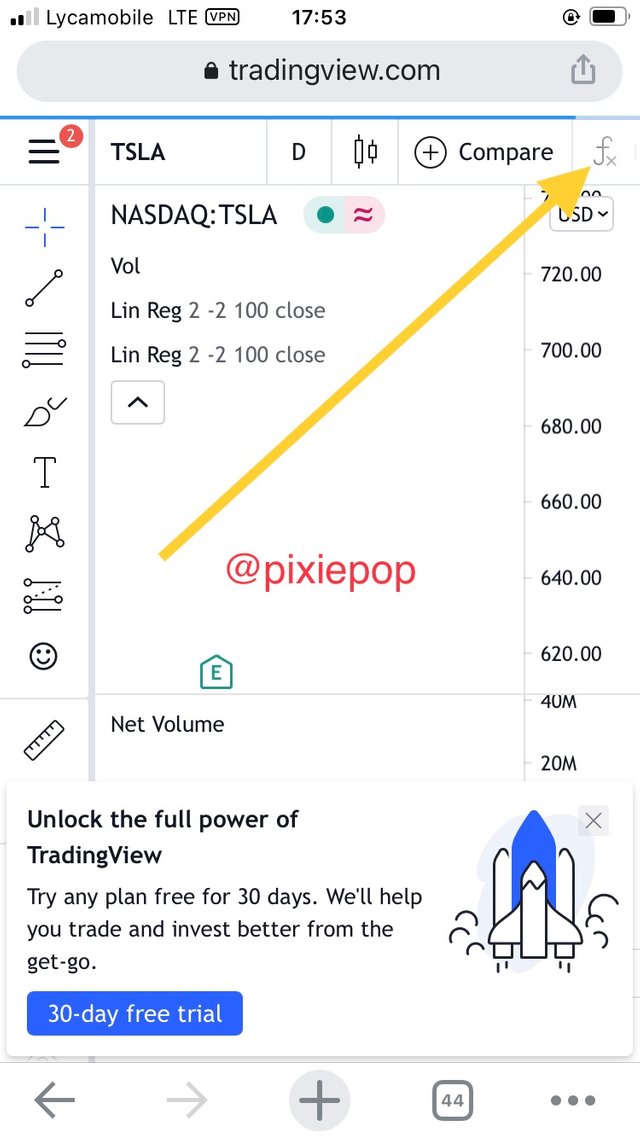
On the chart showing up, one can include the KDJ indicator by going to the the fx symbol.
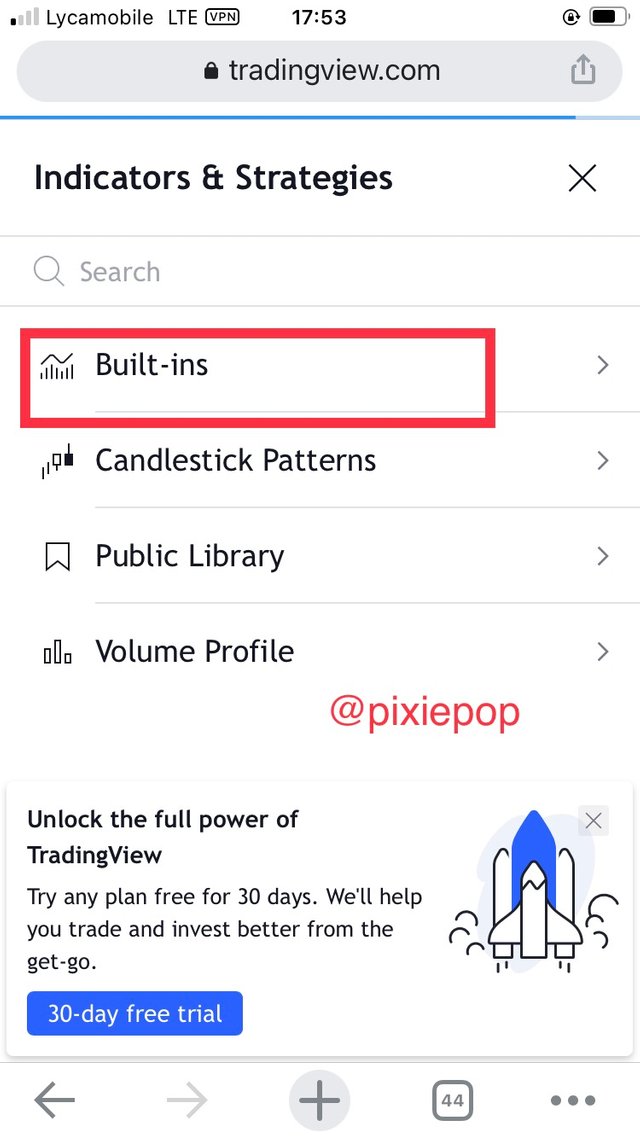
On choosing the fx symbol, a menu is brought with various options and one can choose built-ins .
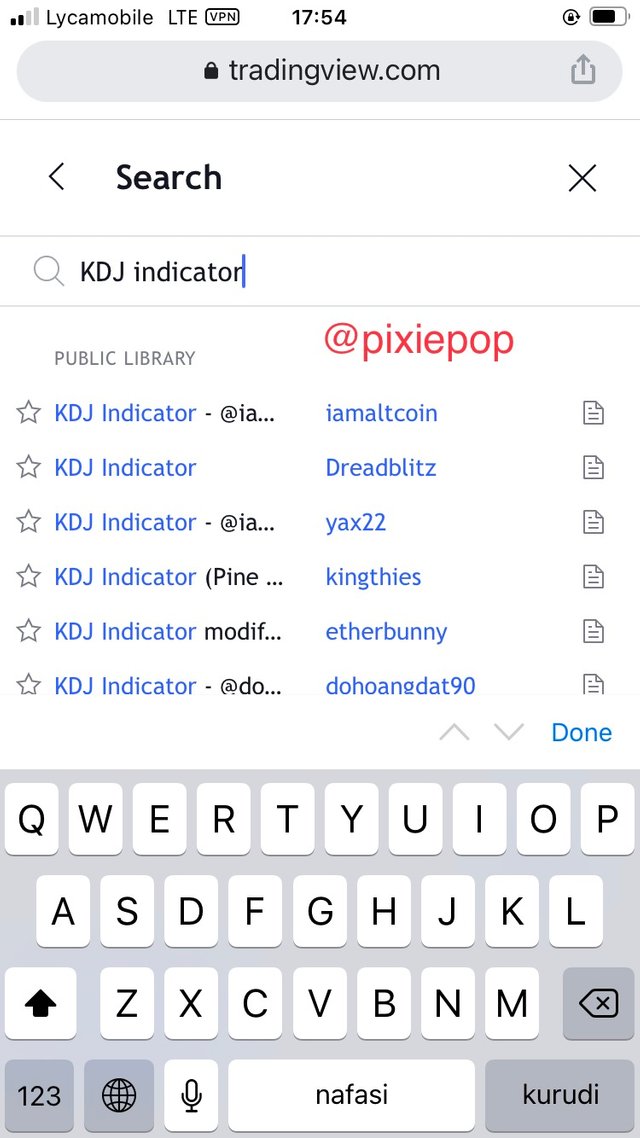
A search option is brougt where one can type in the indicator they are searching for. In this case since we are searching for the KDJ indicator, then one has to type in KDJ indicator.
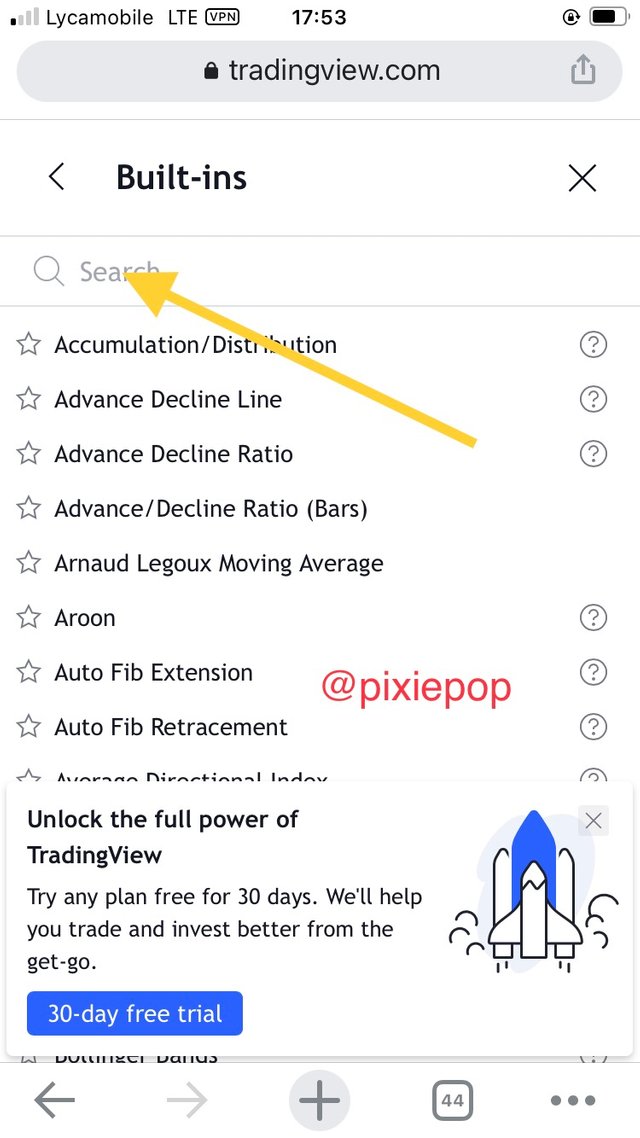
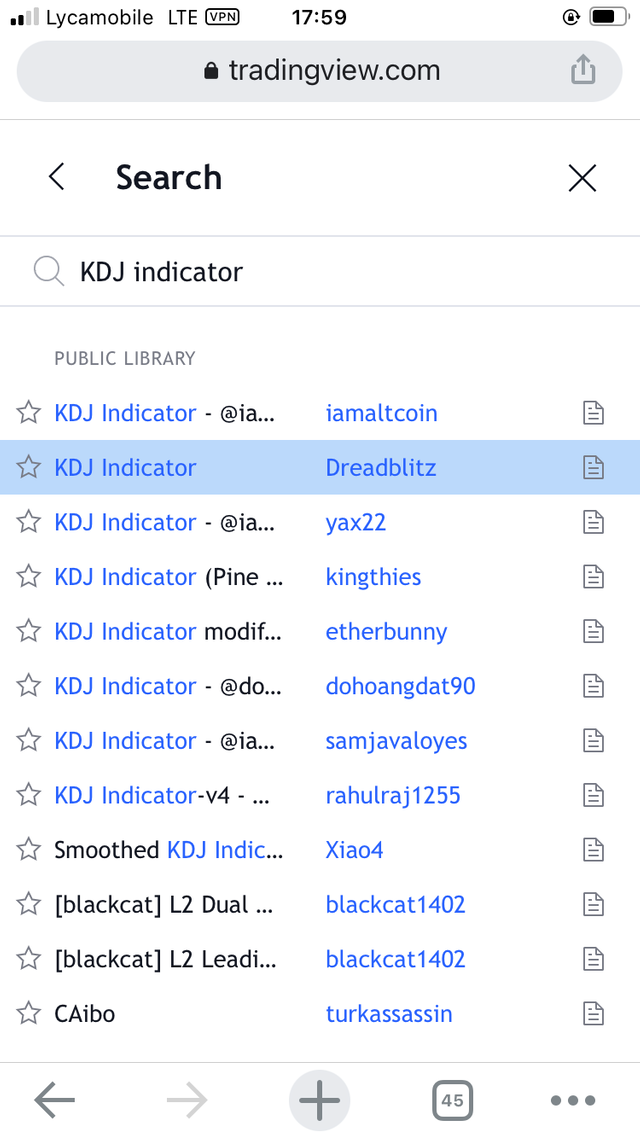
Various options will be brought for one to choose.
Then one chooses the KDJ indicator they intend to use and it will be displayed on the chart.
4) Differences between KDJ, ADX and ATR.
KDJ is used to determine the accuracy of a trend direction. ADX on the other hand determines when the price is trending strongly while ATR determines the degree of price volatility. KDJ and ADX deal more with trying to figure out the trends however ATR focuses on degree of volatility of a price.
KDJ is made of the lines; the K, D and J lines. The ADX and ATR indicators however do not have three lines like KDJ.
5) Use the signals of the random index to buy and sell any two cryptocurrencies. (Screenshot required).
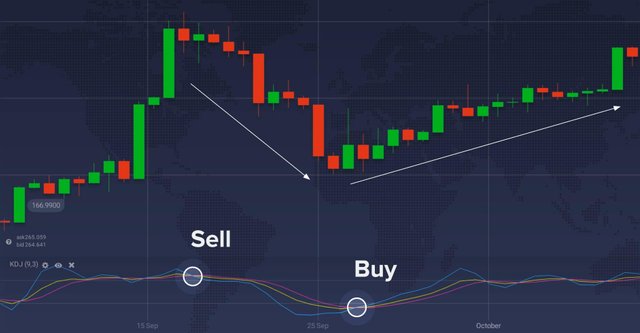
On the chart above, the KDJ indicator clearly shows the overbought and oversold prices. Therefore where the crypto is being oversold, the prices are low therefore that is the right time to buy. Therefore I am going to place an order on FXCM.
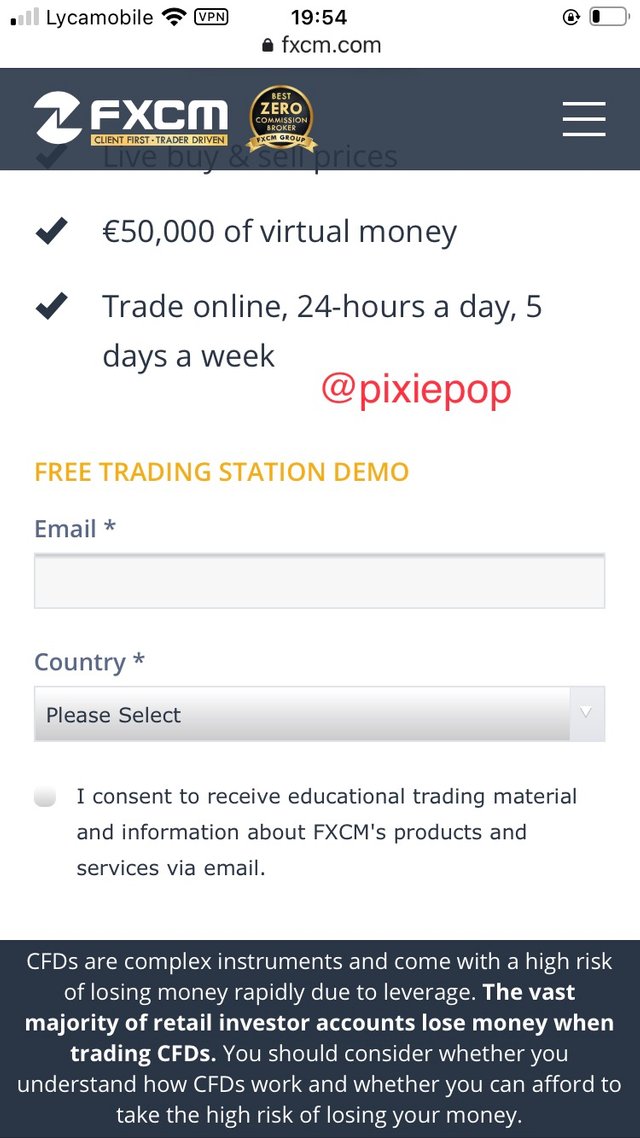
First of all I had to go to their website to open a demo account.
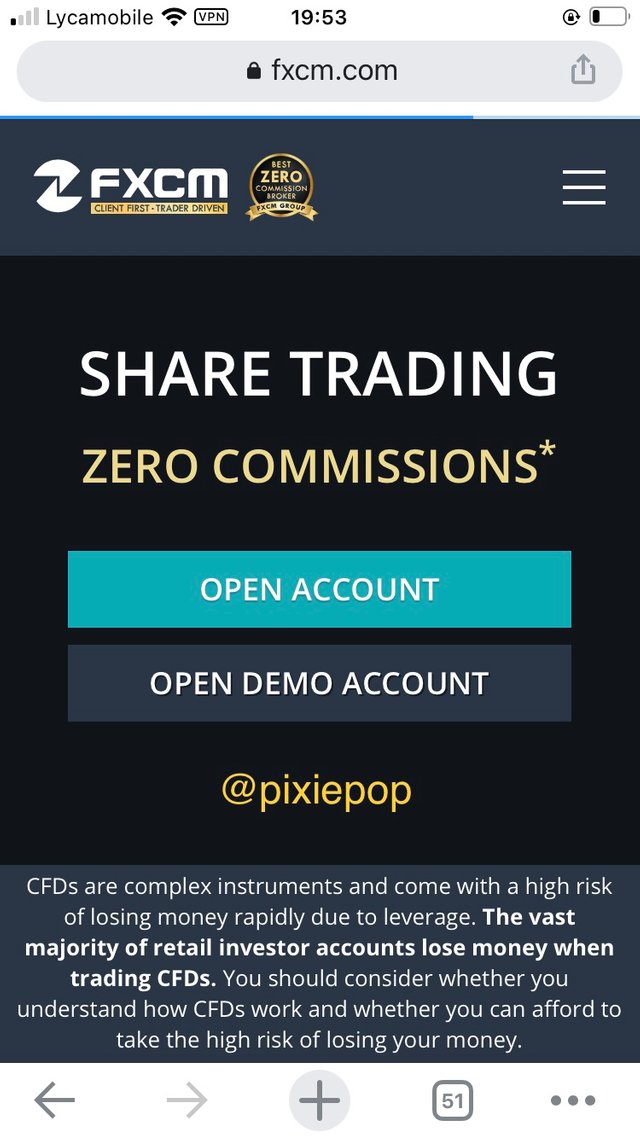
One will have to fill in the information required and on doing that an email is sent with the details of the password and username and thereafter one can download the app and sign in.
You have been curated by @yohan2on, a country representative (Uganda). We are curating using the steemcurator04 curator account to support steemians in Africa.
Keep creating good content on Steemit.
Always follow @ steemitblog for updates on steemit
Hi @pixiepop, thanks for performing the above task in the eighth week of Steemit Crypto Academy Season 3. The time and effort put into this work is appreciated. Hence, you have scored 5 out of 10. Here are the details:
Remarks
Commendable effort but fair performance. You have displayed a fair understanding of the topic. You have performed the assigned task. However, you did not provide new information to this course, as most of the points mentioned have been indicated by several participants. You work could have been more original and clearer with content structure.