[ UNDERSTANDING TRENDS ] - CRYPTO ACADEMY / S5W1- HOMEWORK POST FOR @reminiscence01".
Edited on text on photo app
UNDERSTANDING TRENDS

QUESTION 1
1a. WHAT DO YOU UNDERSTAND BY A TRENDING MARKET?
ANSWER
A trend is the total direct focus of a market or an asset's price. When we say market trend or trending market we simply mean the movement of the market price in a particular direction which can be an upward direction (upward trend) or a downward direction also known as a down trend.
It is the direction of the market or asset price of the market determined by the forces of demand and supply. Indeed it is well known today that as a trader the trend is your advantage. So when we have more demands in the market we definitely see prices going upwards just as the law of demand states.
The higher the demand the higher the price of a commodity ans vice versa. Hence the case with the bullish trend.
On the other hand the law of supply in economics says the higer the price the more the quantity of goods supplied hence in this case as the sellers increase there will be a down trend as more sellers will bring about low price.
This is the case of the bearish trend.
1b. WHAT IS BULLISH AND BEARISH TREND
BULLISH TREND
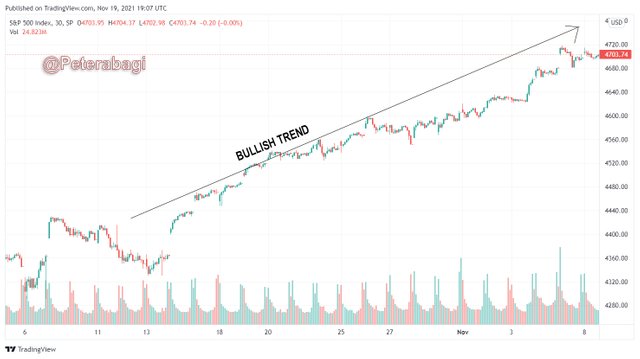
The bullish trend is the ascending price of the market over a period of trade. A bullish trend is the continuous increase of a market price, where it stands above the previous low price and also closes above the previous high price. This actually an upwards trend in market.
This bullish trend can be observed by two sloping trend lines ascends higher than the previous high point and refuses to go lower than the previous low point.
So i understand that in the bullish trend it is basically making higher highs and higher lows.
 SPX/USDT
A BEARISH TREND
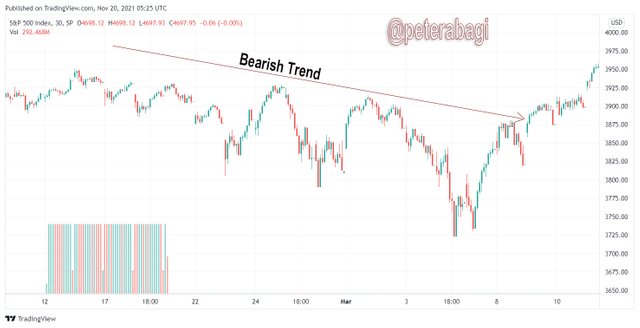
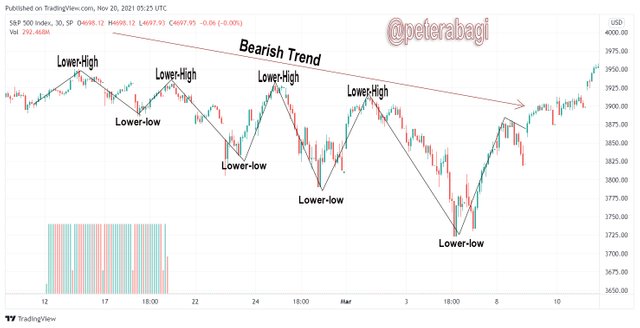
The bearish trend seems to be just like the opposite of the bullish trend. It has to do with the descending of the market price over a period of trade. A bearish trend is a continuous decrease of a market price, when this happens the price doesn't go above the previous high price and still it rather goes below the previous low price.
I understand that this makes a lower higher formation and a lower low formation. This means a fall in price below the previously lower point.
SPX/USD
QUESTION 2
EXPLAIN THE FOLLOWING TREND IDENTIFICATION AND GIVE AN EXAMPLE OF EACH OF THEM
THE MARKET STRUCTURE
The market structure is an insight into the market, it helps you to know the current state of the market. I understand that the market structure is how the price of the market moves.
The market structure is a picture of the state of market which helps you to know the movement of the market trend. The market structure helps the trader to read the market and know the directions of the market.
The market could be in a bullish movement or a bearish movement, which means an upward trend or a downward trend or even a range.
So when a trader is able to read the movement of price in the market then the market structure is serving it purpose. Market structure is basically the movement of price in the market during trading.
THE BULLISH TREND
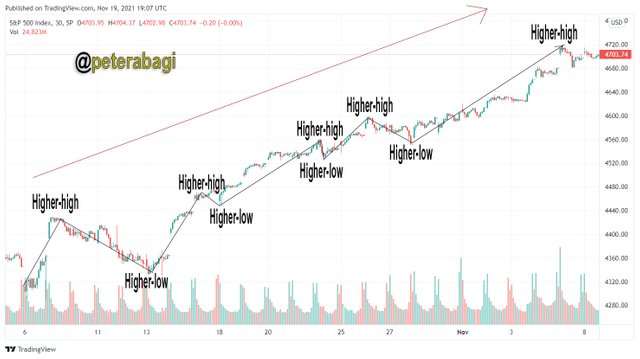
The bullish market i have come to understand from the lecture is identified when the market is making higher highs and not making higher lows. Here one can observe the market rise beyound the previous high and doesn't break down beyound the previous low point.
 SPX/USDT
THE BEARISH TREND
The bearish market on the other hand is identified when the price is making lower highs and lowerlows.
This is so interesting that it can help a buyer at every instant of a time to come into the market and know what to expect with the focus of the market price and take profits when supposed to.
 ***SPX/USDT
THE RANGE
The range here con note an equilibrium in the market trend, here the market price doesn't go above the previous high nor does not go below the previous low. One could simply say it is the proces where by the price of demand and supply takes a rectangle shap which represent an equilibrium.
TRENDLINE
Trend means a pattern or the way something has been moving. One can know market trend by observing the market.
From the lecture i understand trendslines are the means by which the traders get to know the direction of the market again and again, it gives the trader a total focus and helps him create an expectation for the market.
For clarity one could visualize this trendlines using a dual low points for an upward trend and a dual high points for a down trend, hence when a trendline is not validated it can break and not only break but break easily.
A BULLISH TRENDLINE
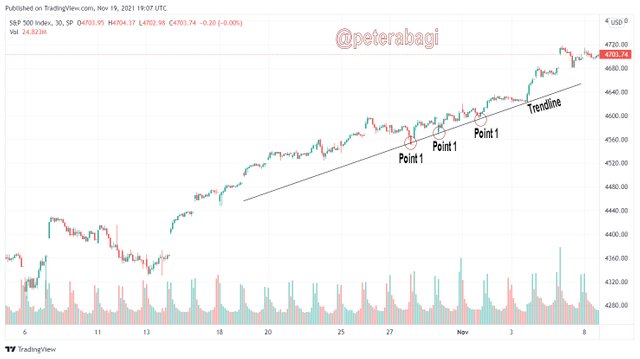
A bullish trendline is basically observed when a price is trading above the trendline. Here whenever the price hits the trendlines it revers upwards, one could say it is an upward trendline.
Traders always take advantage of this trendlines to enter the market and make profit until it expires.
 SPA/USDT
THE BEARISH TRENDLINE
The bearish trendlines is a downward trendline. When the price of the market is trending below trendlines. The bearish trendline can be said to be the direct opposite of the bullish trendline. However , both trendlines are to the advantage of the trader.
REMEMBER THE TREND IS YOUR FRIEND.
 ****SPX/USDT
QUESTION 3
EXPLAIN TREND CONTINUATION AND HOW TO SPOT THEM USING MARKET STRUCTURES AND TRENDLINES
TREND CONTINUATION
Trend continuation as the name implies is the flow of a price in a particular direction due to the activities of the traders. Trend continuation refers to the activities of traders in the market that pushers up or down the market price.
This happens as fluctuations or retracement which make up zig-zag patterns on the chart.
A trend continuation is a continuation of a current trend after a pullback or consolidation has occurred in the market. A trend continuation can occur in a bullish market or a bearish market.
TREND CONTINUATION USING MARKET STRUCTURE
Just like explained earlier the market structure is the direct focus of the market price over a period of trade.
BULLISH TREND
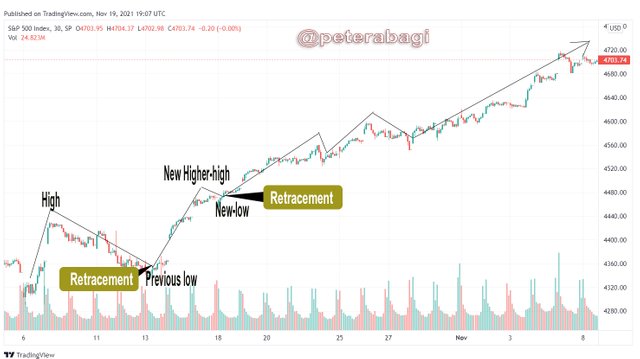
To spot continuation in a bullish market structure which is an uptrend
It means one will observe that the new low point must not be lower than the previous low and
The new high point must be higher than the previous high point. This is for a spoting a bullish market structure continuation.
Here is the chart
 SPX/USD
BEARISH TREND
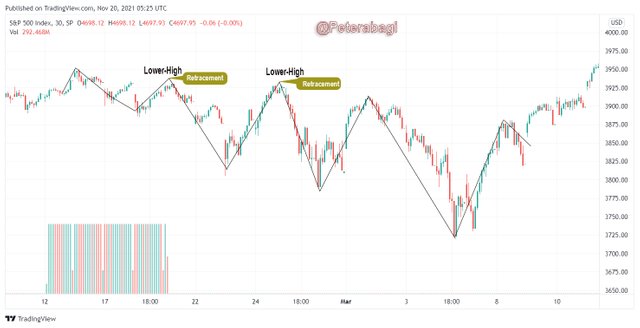
On the other hand for a down trend a bearish trend the retracement creates a high that is lower than the previous high. When selllers are still in control of the price it becomes hard for buyers to push the prices above the previous high. This point serves as an entry point for a lot of traders before the next impulsive move.
In the bearish market structure trend continuation one should note the following.
The high point during retracement does not get to the previous high point and
The new low point created must be lower than the previous low point. All this explains the market structure trend continuation.
 SPX/USDT
SPOTTING TREND CONTINUATION USING TREND LINES
A trend line as i explained earlier is a tool used by the trader to identity the direction of the market. The trendline if well followed will give the trader desired results because it serves as a unique dynamic support and resistance during a trending market.
By trending market here i mean the price direction of the market either upward or downward trend.
So basically the trendlines gives the traders insight information about the direction of the market.
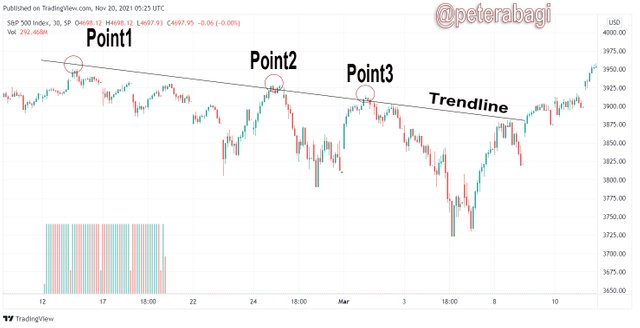
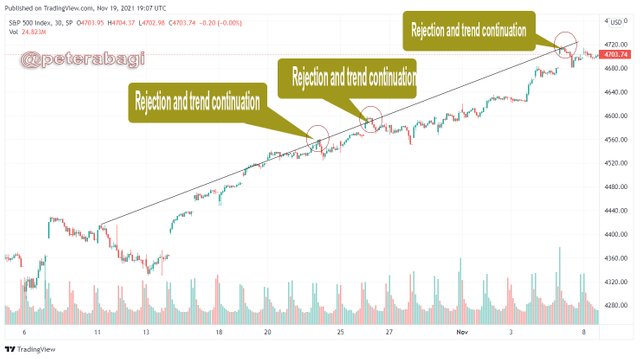
To draw a trendline one can do so by joining two points on the chart drawn to the future. Observing a trending market the price retraces back to the trendline and get to be rejection as a condition for continuing the original trend from the beginning.
The reality of the above assertion is shown in the chart how price bounces back up adter it hits the trendline to continue the bullish trend. A break of the trendline is a violation of the bullish trend and also a trend reversal signal
FOR A BULLISH TREND
 SPX/USDT
FOR A BEARISH TREND
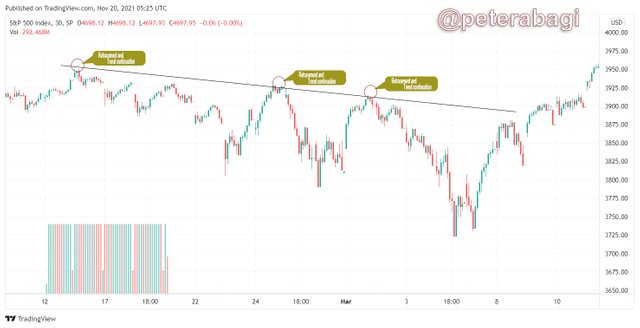 SPX/USDT
QUESTION 4
PICK UP ANY CRYPTO-ASSET CHART AND ANSWER THE FOLLOWING QUESTIONS.
i. Is the market trending?
The below market chart agrees with me that the market is trending.
SPX/USDT
ii. The current market trend is a bullish market trend by this i mean an upward trend
QUESTION 5
CONCLUSION
The importance of the knowledge of the trending market can not be over emphasize as it helps one to know the phases trends patterns of the market whether it is an uptrend or a downtrend inorder to know when to come in as a trader.
I have learnt so much from this assignment i am sure i can be able to teach others about market trends, market structure, trendlines and how to spot trend continuation. Thank you for the lecture.
Hello @peterabagi, I’m glad you participated in the 1st week Season 5 of the Beginner’s class at the Steemit Crypto Academy. Your grades in this task are as follows:
Observations:
You have failed to adhere to the homework guidelines by using charts of the index market. This is crypto academy and every study here should only be focused on the crypto market.
Thank you for participating in this homework task.
Hi @reminiscence01
Thank you for your observation Sir. This is a beautiful learning experience for me thank you for this opportunity sir. Am so grateful and i promise myself to improve greatly.
HI
@reminiscence01 SIR THE POST IS MARKED BUT NOT VOTED, IT IS 6DAYS AGO ALREADY SIR.
@sapwood
@steemcurator02
Wow these is wow, your explanations was a good one sir and i was clarified about some trading terminologies, i am so inspired and motivated towards engaging more research, well-done pastor @peterabagi