[RECOGNIZING SIMPLE PATTERN IN TRADING] - CRYPTO ACADEMY / S5W2 - HOMEWORK POST FOR @sachin08

QUESTION 1
WHAT IS YOUR UNDERSTANDING ABOUT TRIANGLES IN TRADING.
The triangle pattern is a specific figure formed on the price chart, typically identified when the tops and the bottoms of the price action are moving towards each other like the sides of a triangle.
When the upper and the lower level of a triangle interact traders expect an eventual break out from the triangle. As such many break out traders use triangle formations for identifying breakout and entry points.
The triangle is one of the most technical patterns one could run into, one of the main reasons is that it is just so identifiable. Hence can be recommended for beginners. A triangle is a couple of trendlines tha meet at an apex, triangles can be seen in 3 different forms:
- Ascending Triangle
- Descending Triangle
- Symmetric Triangle
- THE ASCENDING TRIANGLE which means the price in the market is rising over time, the habit of this triangle is that it makes higher high as the asset price goes above the same price level and does not go lower than the current low level.
This triangle is also known as the BULLISH TRIANGLE.
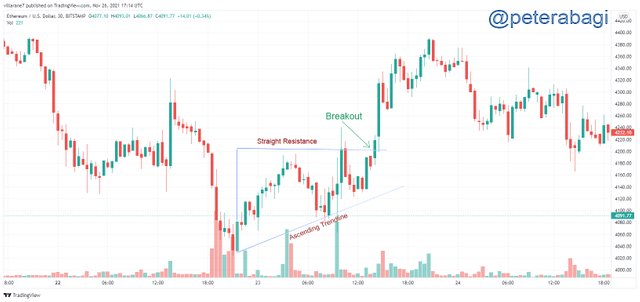
ETHEREUM/USDT
THE DESCENDING TRIANGLE which means the price in the market is dropping over time, is characterized by the asset price not meeting the same upper price level yet still goes below the previous low level.
This triangle is also known as the BEARISH TRIANGLE.
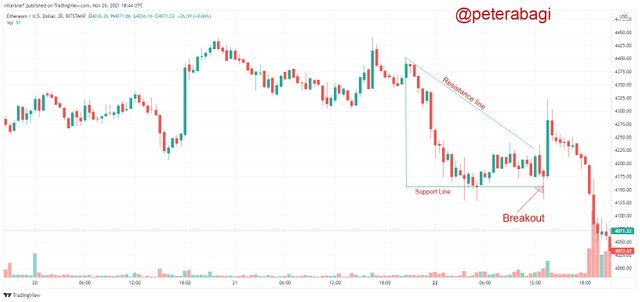 ETHEREUM/USDT
THE SYMMETRIC TRIANGLE which is just Symmetrical in shap, it is just the market trading banks can also be seen or called the neutral version. It is characterized by the resistance and support lines and all breakout points observed are entry points for trader's to buy or sale.
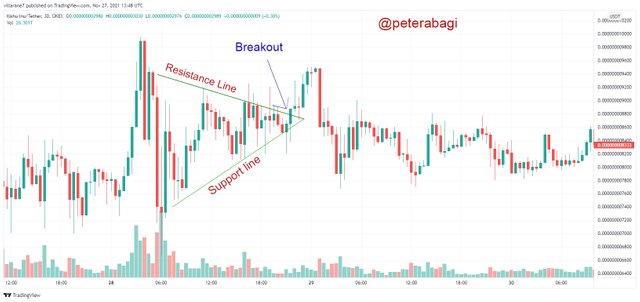
KISHU/USDT
QUESTION 2
CAN WE ALSO USE SOME INDICATORS ALONG WITH IT TRIANGLE PATTERNS? EXPLAIN WITH SCREENSHOTS.
- Ascending Triangle pattern with indicators
Remember the ascending Triangle is the bullish movement of the market price, hence it is more preferably to trade the breakout from the triangle upward.
It is by paying attention to the horizontal line of the triangle (resistance area) that one will be able to pick an entry point slightly above the resistance area and stop loss will be set below the rising edge of the triangle.
ETHEREUM/USDT
- Descending Triangle pattern with indicators.
Expert and champs permit me to say have agreed that the entry point for the descending Triangle is below the support point where the buy before the start of the next bullish trend.
ETHEREUM/USDT
- Symmetrical Triangle Pattern with Indicators.
The Symmetrical Triangle is featured by two lines the resistance line and the support line pointing in two directions.
When there is a break out below the support line it is a bearish move on but when there is a break out above the resistance line there is a bullish movement.
KISHU/USDT
QUESTION 3
EXPLAIN FLAGS IN TRADING IN YOUR OWN WORDS AND PROVIDE SCREENSHOTS OF BOTH BULL FLAG AND BEAR FLAG
A Flag pattern is a strong trending move of large bodied candles followed by a weak pull back of small bodied candles.
We have the BULLISH or BULL FLAG PATTERN AND BEARISH Flag pattern.
A BULL FLAG
A bull flag pattern can be identified when the price takes a flag pattern after making higher -highs and a higher -low move ( an impulsive bullish movement) and the flag pattern is pointing in a downside direction.
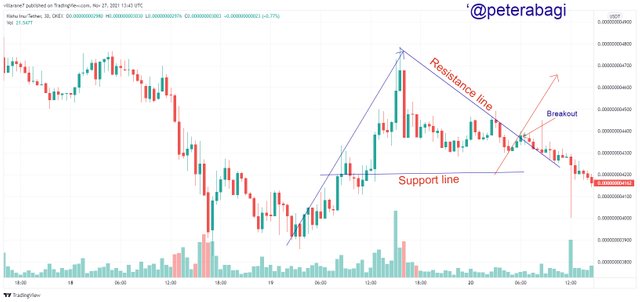
KISHU/USDT
BEAR FLAG
Bear flag Pattern on the other hand is the opposite of the bull flag pattern. The bearish flag pattern can be identified when price takes a flag pattern after making a lower-high and a lower-low movement (a bearish movement) and the flag pattern is pointing in upside direction.
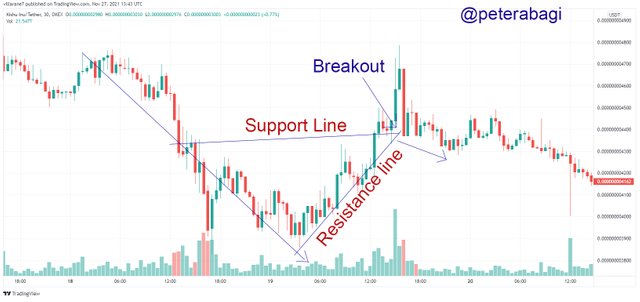
KISHU/USDT
Hence for both bull flag and bear flag pattern we have to consider resistance line and support line.
For the bull flag pattern when the price breaks the Resistance Line, one can call that point our entry point.
For the bear flag pattern when the price breaks the support line, we can now consider that point our entry point.
QUESTION 4.
SHOW A FULL TRADE SETUP USING THESE PATTERNS ON ANY CRYPTO CURRENCY CHART (ASCENDING TRIANGLE, SYMMETRIC TRIANGLE, BEAR FLAG)
A FULL TRADE SETUP FOR AN ASCENDING TRIANGLE SHOULD LOOK LIKE THIS
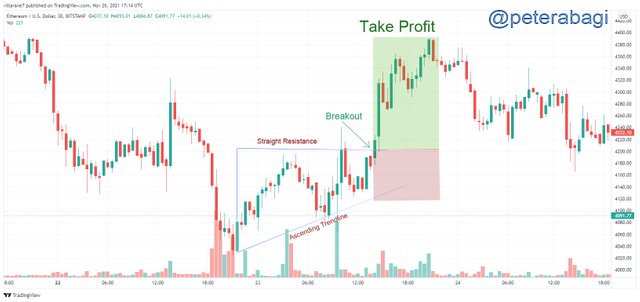
ETHEREUM/USDT
A FULL TRADE SETUP FOR A SYMMETRICAL TRIANGLE SHOULD LOOK LIKE THIS.
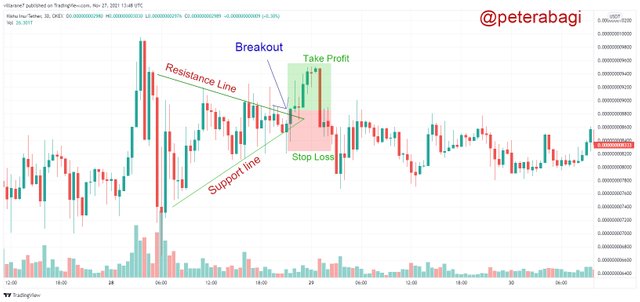
***KISHU/USDT
A FULL TRADE SET UP FOR A BEAR FLAG SHOULD LOOK LIKE THIS
ETHEREUM/USDT
QUESTION 5
CONCLUSION
As a participant in this class I have been able to do my assignment which has given me a good knowledge about triangles in trading, I have learnt about flags and how to set up a full trade using the various patterns.
My sincere gratitude to #cryptoacademy, I hope to do more research on this topics I have been taught and gain more knowledge.