Steemit Crypto Academy | Temporada 3 Semana 8 - Gestión de riesgos en el comercio
Source
Risk management is the most important thing in trading since this is what determines the profits and losses that will be reflected throughout the time of operation, we have to keep in mind that our goal is to have more profits than losses in the short, long and medium term, therefore we will implement strategies that improve our performance.

Define terms:
Buy stop:
Buying is done above the current price for sure above some resistance large volume is a strategy used by trodar to enter trades and thus grab a rise next resistances or to historical highs take profits and exit. depending on the method used you can go long quietly important to maintain a solid strategy that works and manage the risk to losses as I have said.
keep in mind to place stop losses in case the behavior of the trend takes an unexpected turn.
Example:
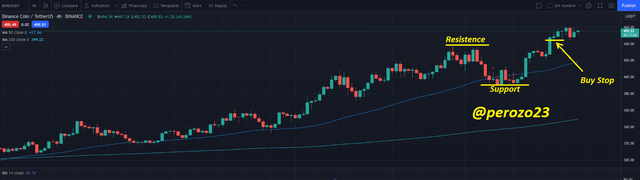
Studying the BNB/USDT 4-hour chart
I identified the resistances and supports I could also understand that the market is in an uptrend so I decided to enter in a leveraged long in that position taking into account the risk management 1:1 for this operation then we can identify that the Buy Stop is just above the previous resistance.
Source
Sell stop:
In this sale we must place the sale below the current prices according to our strategy this is used to protect the invested capital of the high volatility of the market to create stop loss and thus at least sell at supports and then buy below where we will perform a technical analysis and see if it is feasible or not to buy at those points again to take the long again leveraged or simply in spot, in addition to this we protect our assets from liquidations or be trapped in operations for a time not stipulated.
Therefore study the market that we are going to operate is paramount to establish rules and strategies that have generate money is the second most important part in the following chart we will see a clear example of sell stop:
Example:
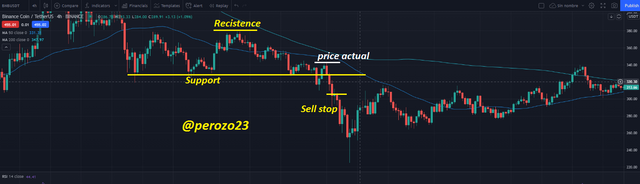
Studying the BNB/USDT 4h chart.
Therefore in this second graph we can see a stop order just below the current price to place it sees the previous supports and place it below these, to exit a trade or just buy and go short to make profit on this trade since the technical analysis tells us an oversold. we know what will happen in the future we take positions immediately.
Source
Buy limit:
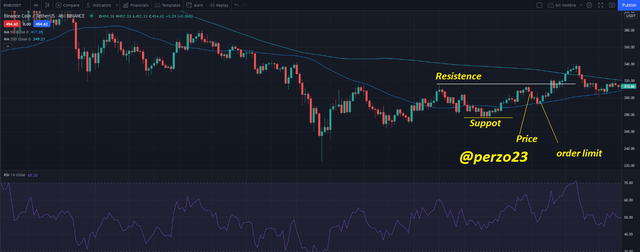
It is when we place a purchase order below the current price perhaps at the end of a resistance this is done with a previous technical analysis of the market also with sentimental analysis, for this we must place the purchase below at some support to then go long or spot. and take profits in some resistance above depending on what the technical analysis tells us the important thing would be to take profits 1:2 to make this operation worth doing.
In the following chart we can see how to buy below the current price where it was forming a support I see that in the technical analysis that I made indicates me an oversold so if I buy at this point get profits and it is more likely to buy higher. thus taking profits 1:2 or 3 times the risk to losses.
Example:
Source
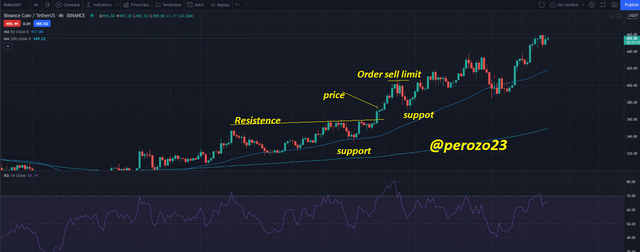
Sell limit:
It is an order that is made to sell above the current price I mean at some resistance or if the indicator tells us that it is overbought we must sell also using the SRI indicator we can look if there is oversold in this way we can identify patterns on the chart and place our sell limit point at that precise moment. this we do to take profits after entering operations below.
Or we simply want to take a short is valid of any of the two strategies selected remember the important thing here is to make money to increase our capital slowly without haste as the rush or eagerness could bring us unwanted consequences.
Clear example of a sell limit:
In the chart below we can see the order placed above the current price at a resistance and possible shark fin pattern, then we see the price pull back quickly this is due to the market correction and the pattern and the RSI indicates an overbought then we take a leveraged short for higher profits. taking 1:1 as % profit and loss.
Source
Trailing stop loss:
It is a normal stop loss but that chases the price is chasing the price to try to take the highest possible profits and thus reduce the risk of large losses remember that the price is very volatile in these markets then placing a trailing stop loss can maximize these gains. the trailing stop loss is moving in parallel to the current price so it helps us protect our assets is used in any Exchange or market.

Margin call:
It is important to know the use of the margin call when a cryptocurrency trader runs out of funds he can call the Exchange and ask for one more loan this way he stays in operation for the time determined by his operation remember it is very dangerous to do this as you are increasing the risks of losses and you will not be complying with the first rule 1:1, 1:2, 1:3 increasing the risk 2:1 2:2 would no longer be only can be done if you have strong signals in the technical analysis to perform that operation and if you have enough experience in the market otherwise it is not recommended.
If a cryptocurrency trader runs out of funds, the market is against him and he does not make a margin call, then he will be automatically liquidated and will lose the trade at that moment.
Understanding Risk Management in Trading:
The management to the risk is the most important of this will depend our capital management we must implement a rule by operation and thus establish a solid and useful strategy that allows us to go increasing our capital more times than the losses by erroneous operations or unexpected trend changes, when we are going to operate a market we perform technical analysis and thus we can determine points of entries and exits but what happens if these fail ? we have a loss what we must do is that this loss is minimal is impossible to have a 100% correct in all operations performed.
So let's determine the golden rule for me is 1% of my balance is for losses and 1 to 3% is profit for operations with already identified trends and patterns of overbought or oversold could be 3% of our capital for profits being 1% for losses so it is worth performing the operation below.
We must also follow some main characteristics to perform operations in the market and thus have a good risk management and therefore a good capital management which are .
To plan the percentages of entries and exits of a market.
To make the respective analysis to the market, technical, fundamental, sentimental, etc.
Knowing how to identify as many chart patterns as possible.
To use indicators such as RSI, ADX, ATR, etc.
Know how to identify entry and exit points of the market to place the respective stop loss, stop limit, etc.
Moving average trading strategy
Moving averages are very important for charting with them we can identify bearish or bullish trends depending on how they are we can also identify and predict corrective movements for each given movement and if we combine them with indicators like RSI and ADX we will have a very strong tool to identify movements we can also identify patterns for these analysis.
I would like to say that I like to use the moving averages that indicate the death cross and golden cross in this way we can identify short and medium long periods without problems the moving lines should be 50MA and 200MA when they cross we can define trends for example when there is a downtrend on the chart we can see how the 200MA moving average crosses below the 50MA moving average line. with long and strong movements.
And when there is an uptrend we can see when the 50 moving average line crosses above the 200 moving average to signal that there is a golden cross which indicates an uptrend.
We must understand that the risk factor is mostly psychological because we let feelings guide us in trading for example hope, fomo, fear, greed are feelings that lead to total bankruptcy and it is very important to understand that feelings have no room for trading markets.
next we are going to see the chart:
Steem/usd daily chart my prediction today 8/21/2021
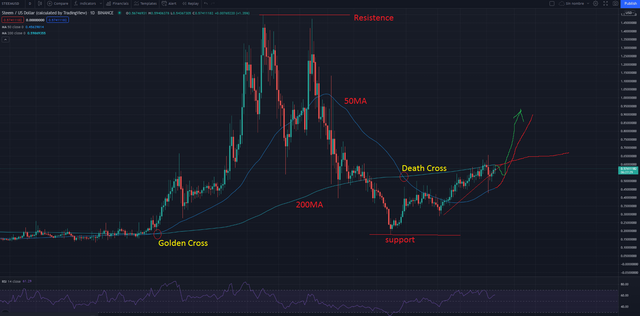
Source
Conclusion:
Risk management is the most important thing that we must understand for each operation also identify trend by moving averages and make correct technical analysis understanding each of the characteristics mentioned in question 3 , for this we should study the patterns, indicators, and moving averages for this we must know the rules of risk management 1:1 for most of the entries and when we are very sure with sources signals we can go to 1:3 per operation being 1% of the capital to losses and 3% of the capital to profits in this way we will be very protected and we will get profits in the long run. good capital management is paramount for each entry.
@yohan2on Thank you
Congratulations, your post has been upvoted by @scilwa, which is a curating account for @R2cornell's Discord Community. We can also be found on our hive community & peakd as well as on my Discord Server
Hi
Thanks for participating in the Steemit Crypto Academy
Feedback
Your risk management lacked a demonstration of the stop loss and Take Profit on the chart.