Steemit Crypto Academy Season 3 Week 2 - Beginner's Course | Introduction to Charts | Homework Post by @patrickbonyah


Explain the Japanese Candlestick Chart? (Chart screenshot required)

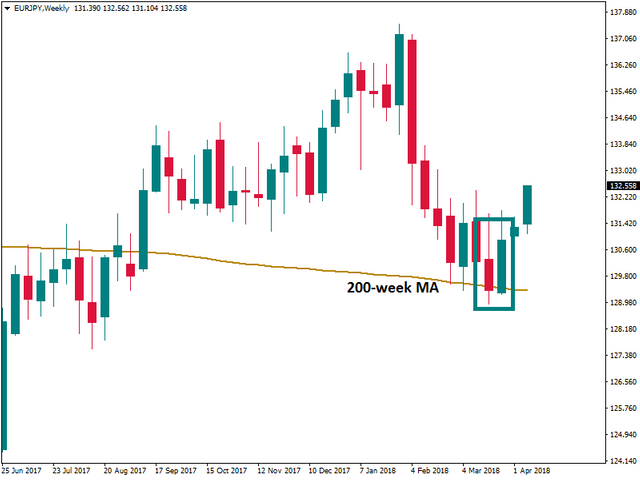
A Japanese candlestick is a technical tool invented in Japan in the 1700s by Munehisa Homma a rice trader based on the understanding of demand and supply, and published by Steve Nison in 1991, 320 paged books called "Japanese candlestick charting techniques".
The Japanese candlestick illustrates the interactions between buyers and sellers in the market graphically by showing the various prices and points in the market during transactions.
Basically, the Japanese candlestick is categorized into four(4) parts, namely; open, high, close, and low, representing particular prices and points movement at a given time period, which helps to analyze and predict if there would be a bullish or bearish trend, after looking at the chart.
In simple terms, the Japanese candlestick is a technical tool invented to analyze and indicates the movement of prices and points in the market.
Describe any other two types of charts? (Screenshot required)
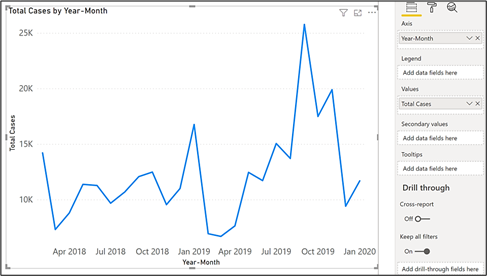
A line chart displays information within a particular time frame, it is the simplest and basic of all charts, the line chart lacks more details in the case of the chart where more components are added to display visually, due to its simplicity.
It is plotted by mere a drawing of the line from one close price to other within a given time period.
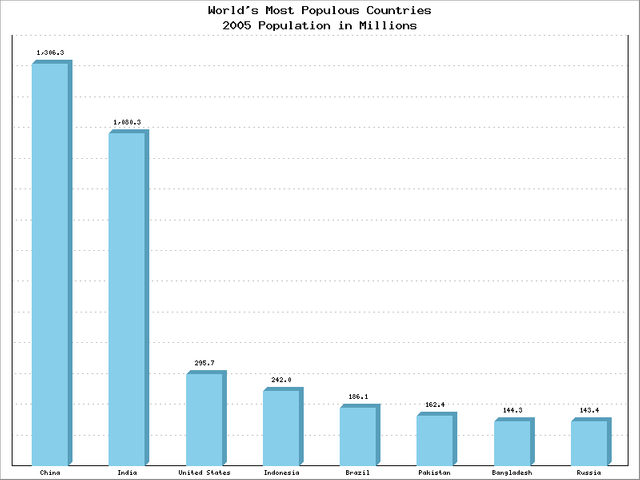
A bar chart contains multiple bars, that have different indications such as open, close, high, and low, which is used to analyze and monitor the price movement of an asset over a given time period.
We plot the bar chart using graphs, representing price on the vertical axis and time on the horizontal axis.
The bars in bar charts are mostly colored either red or green, where red indicates over sold and green indicates overbought market.
In your own words, explain why the Japanese Candlestick chart is mostly used by traders.
The Japanese Candlestick is the most popular technical way of analyzing price action because it focuses or emphasizes much on Open and Close than Highs and Lows, which gives more visual details.
It provides a general overview of the market, in terms of trend etcetera, price, displays market open and close price, high and low points visually, and also security of the Japanese candlestick chart quickly. This makes it use more technical indicators of today.
Describe a bullish candle and a bearish candle identifying its anatomy? (Screenshot is required)
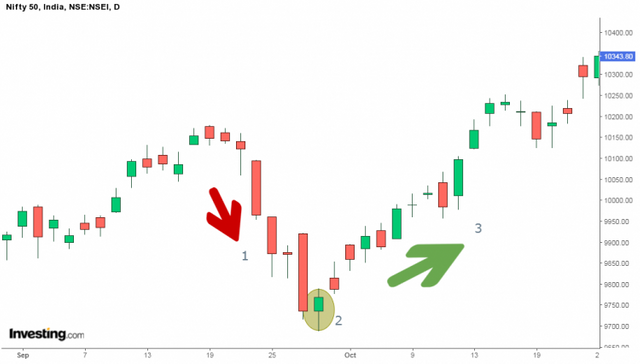
A bullish candle is when the Market price keeps increasing or closes higher than its opening point. Its trend is mostly inspired by major stock movements, often upwards movements in the chart.
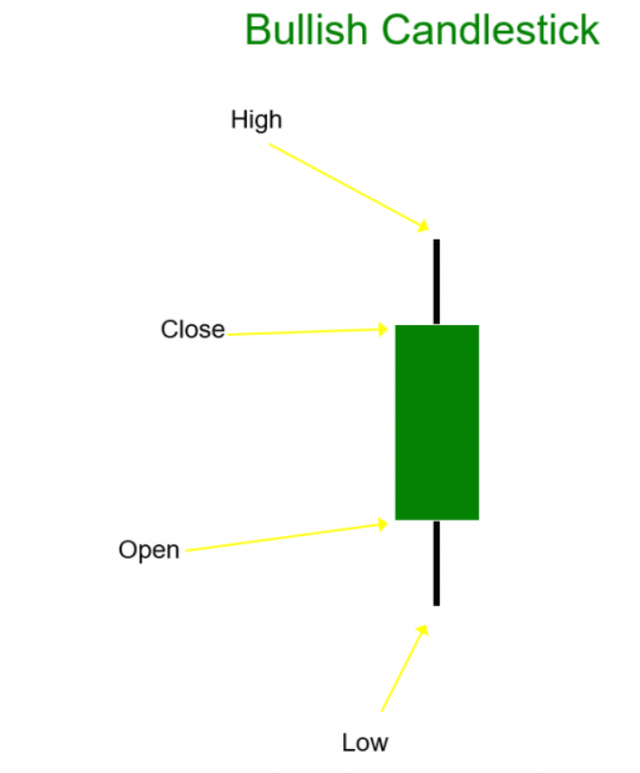
• Open
Represents the first price on an asset over a given time frame, which is seen at the bottom of a bullish candlestick
• Close
Represents the last price on an asset over a given time frame, which is seen at the bottom of the bullish candlestick
• High
Shows the highest transaction made on an asset over a given time frame
• Low
Shows the Lowest transaction made on an asset over a given time frame
Is when the market price is decreasing or closes lower than its opening point. Its trend is represented on the Japanese Candlestick chart by a red stick often downwards movement.
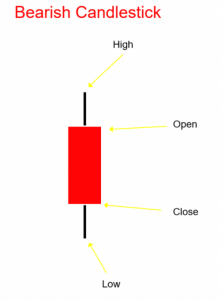
• Open
It represents the first price on an asset over a given time and is seen at the top of the bearish candlestick
• Close
It represents the last price on an asset over a given time and is seen at the bottom of the bearish candlestick.
• High
Indicates the highest transaction on an asset over a given time frame
• Low
Indicates the Lowest transaction on an asset over a given time frame
In conclusion, it appears that, there are numerous candlestick chart, but the most used one is the Japanese candlestick chart, and this is because it laid more emphasis on open and close than high and low to give visual details.
Thank you.
Cc: @reminiscence01
Hello @noraiz , I’m glad you participated in the 2nd week of the Beginner’s class at the Steemit Crypto Academy. Your grades in this task are as follows:
Recommendation / Feedback:
I'm impressed with your research on Japanese candlestick. Thank you for participating in this homework task.
Hi, @patrickbonyah,
Your post has been supported by @nattybongo from the Steem Greeter Team.
Thank you @nattybongo
You have received catchup vote for your achievements; 5.1 to 5.4, achievement 1 and 2 are still been looked at. Thanks