Crypto Academy / Season 3 / Week 3- Homework Post for Professor @lenonmc21 - Topic: All about Trends, Supports and Resistances and simple chart patterns. by @patrickbonyah

Homework
1. Define in your own words what is "Trend" and trend lines and what is their role in charts?
2. Explain how to draw an uptrend line and a downtrend line (Show a screenshot of each).
3. Define in your own words what "Supports and Resistances are and how we can identify both zones (Show a screenshot of each one).
4. Explain in your own words at least two simple chart patterns with screenshots
TREND:
The trend shows the movement of market prices on a chart. The trend also shows how the market prices on a chart move, either upwards or downwards. When the market prices move downwards, it is called a downtrend, and when it moves upwards, it is called an uptrend.
In short, the trend can be defined as the current direction of the market price either downwards or upwards at a given period.
The trend can be grouped into two thus up or bullish trend and down or bearish trend.
The up or bullish trend is where the market prices move towards an upwards direction at a period. And the down or bearish trend is where the market prices move towards the downwards direction at a period.
TREND LINES:
Trend lines are technical analysis tools on a chart that point out to the trader whether to buy or sell in the market. It helps the trader identify the direction of the market prices, either downwards/ bearish or upwards/ bullish.
One can not do away with the trend as far as cryptocurrency is concerned, so the trend has become our friend in the crypto world.
Below shows some of the roles of trend and trend lines;
The trend shows the direction of the market prices, either downwards or upwards.
The trend also helps traders to know the demand and supply qualities; either demand is greater than supply or supply is greater than demand.
The trend line shows how strong a trend is to the trader; thus, when the trend has a series of low highs and is aligned with the trend line, it is a strong trend called a bullish trend.
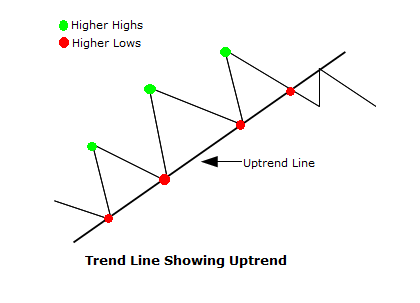
Drawing an Uptrend Line:
An uptrend line is a trend line drawn by joining the first lower high with the lower low in a dynamic form. The traders believe that the lower low formed in an alignment with the trend line, the stronger the trend becomes.
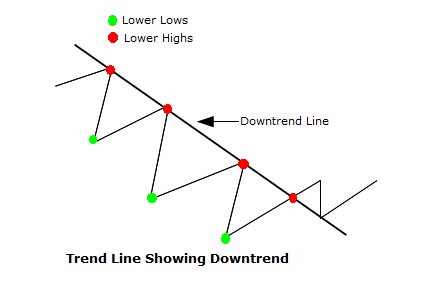
Drawing a Downtrend line:
A Downtrend line is a trend line drawn by joining the higher low with the higher high to monitor the price when it touches it in the future. The traders draw the downwards trend when the market moves from an upwards direction towards the downside.
Resistance and support are important tools in the technical analysis used by traders. They show the traders the direction in which the market price moves towards.
RESISTANCE TRADING: is a zone that pushes the market price down after reaching a certain point in the market. Also, it is an area where price rejects from and starts to move downwards.
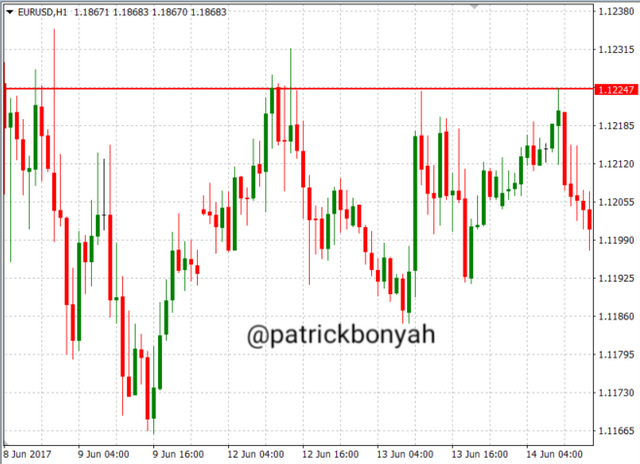
SUPPORT TRADING: is a zone that tends to reverse the market prices after falling at a given period. Also, it is an area where the price rejects from and start to move upwards.
Chart patterns are the patterns
the form on charts, which often displays the price movement, and so help to predict price in the next few minutes or hours.
There are several chart patterns, but below show Some of them;
1. Ascending
2. Descending
3. Double top
4. Double bottom etc.
But would like to talk about Ascending and Descending chart.
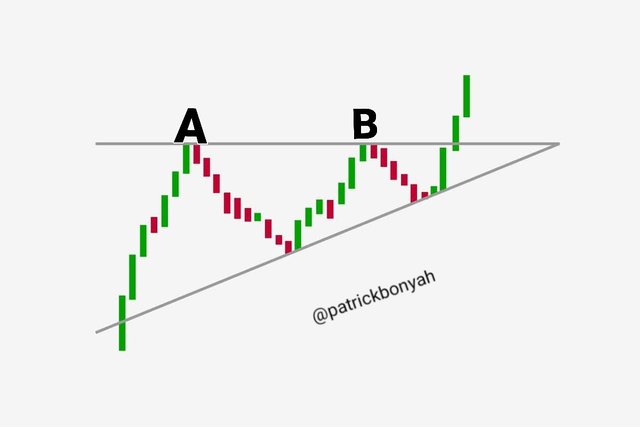
ASCENDING TRIANGLE
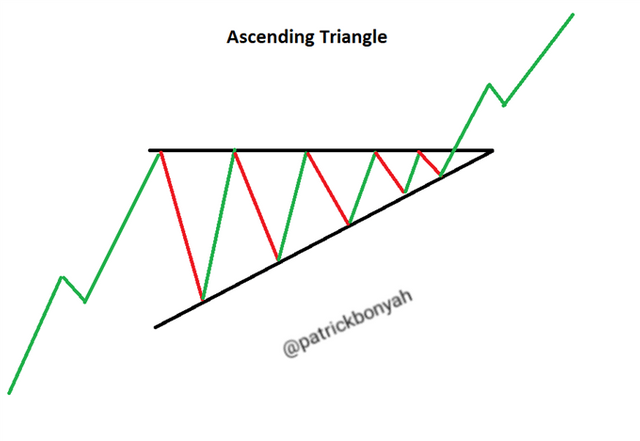
The ascending chart has a three-sided shape with a base and apex. The point label A is where price rejects from and move down without reaching the low then turned to reject on the same point A, label B and then rejects down.
Now draw a base of a triangle. Price on rejecting downwards from point B, but will not reach the low from A, where you will draw another line forming a triangle by meeting point A and B to for the apex. But a break from the triangle will lead the price to move upwards.
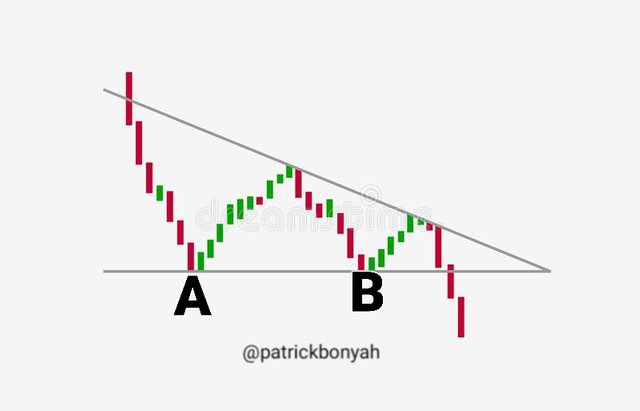
DESCENDING TRIANGLE
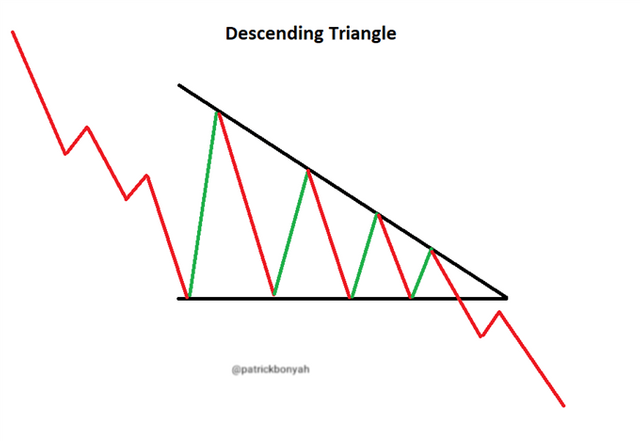
This shows the opposite of ascending triangles, and it identifies the continued downtrend. It is also a three shape pattern drawn from points A and B, which support the chart to form lower highs, which one can connect to support form the apex.
Also, a break out from the triangle will display a movement downwards, where on the apex of the triangle, the stop loss is set above it.
In summary, Trend helps traders to know when? and how? to invest in order to make more profits with the help of the trend line, which displays the uptrend and the downtrend movement on a chart.
Thank you
Cc: @lenonmc21
Cc: @awesononso