Understanding Trending Markets

At any point in the market, price action assumes either of two forms - Ranging or Trending. These two forms are largely influenced by the buyers-sellers inter-play through the forces of demand and supply at play in the market.
There are occasions where the buyers are in control of the market, causing prices to register successively higher prices over some time; and there's another case where the sellers take charge, causing prices to plunge consistently to lower lows.
There is a third case where neither of the two scenarios explained above hold. Neither the buyers nor the sellers are in control and the price seems to bounce within a narrow corridor over some time. At this point, the market is said to be at a point of indecision and neither goes up or down.
The scenarios explained above clearly depict what a Trending and a Ranging market is. While the first two scenarios explained what a trending market may look like, the third captured what is obtainable in a typical ranging market.
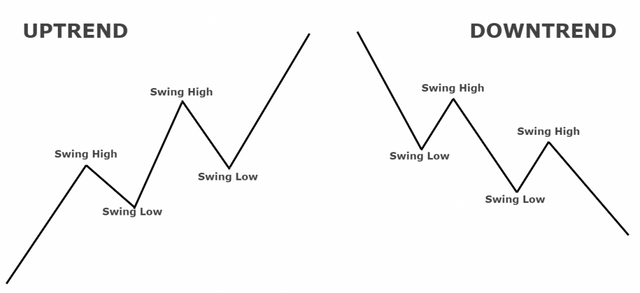
Image source
To drive my point further in context, a trending market is defined as one with a clear direction; i.e it is either going up or down. When a market trend is going up as a result of "buy" pressure, it is said to be an uptrend. Conversely, if the market trend is going downward as a result of "sell" pressure, such is described as a downtrend.
What is a bullish and a bearish trend?
The easiest way to understand what a bullish and bearish trend is will be to first get a perspective of who the bulls and bears are.
Bulls
This is a term in the financial market lingo that is used to describe "buyers". Usually, this set of market players place bets that the price of an asset would go up. In the industry term, the bulls are those associated with "long trades".
Bears
The bears are the direct opposite of the bulls. This is the common lingo in the financial markets used to describe "sellers". This set of market players usually rival the bulls and place bets that the price of an asset would go down. In the industry term, the bears are known for "short trades".
Bullish trend
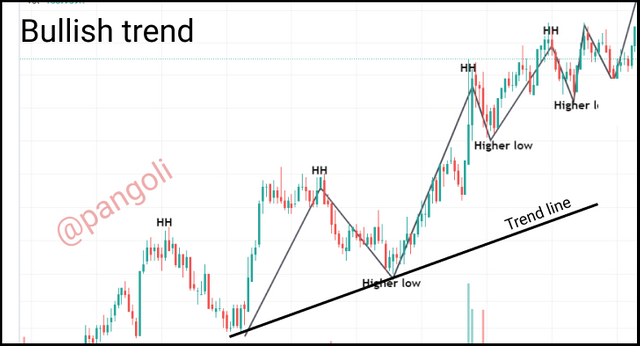
Screenshot
As the name implies, a bullish trend refers to a market trend that is dominated by the bulls. In other words, a bullish trend results when the bulls populate market orders with many "buy" orders, causing the price of an asset to consistently go up over some time.
In a typical bullish trend, the price keeps making new highs and the overall trend of the market is upward facing.
Bearish trend
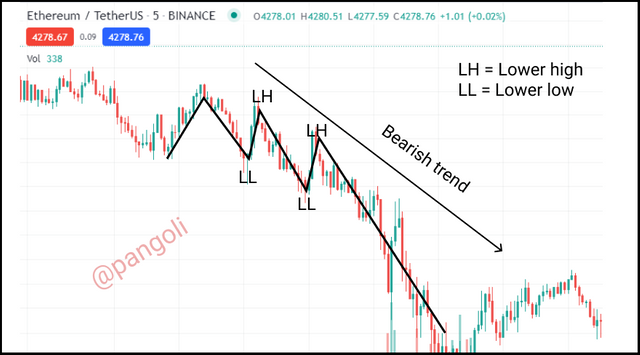
Screenshot
A bearish trend refers to a market trend that is dominated by the bears. A bearish trend results when the bears populate market orders with many "sell" orders, causing the price of an asset to consistently plunge over some time.
Contrary to the bullish trend, the price in a typical bearish trend keeps making new lows and the overall trend of the market is downward facing.
Market Structure and Trendlines with examples (for a bullish and a bearish trend).
i.) Market Structure
Market structure is simply a more technical coinage that contains the overall picture of the market. It gets difficult to have a clear picture of where the market is headed when focused on the microanalysis using smaller timeframes.
Hence, having a birds-eye view of the market is highly necessary as it helps traders distinguish authentic moves from market noise. This is achieved by zooming out on the price chart to have a more holistic view of the market price action.
The market structure usually reveals what is happening in the market from a macro perspective, and lends useful insights into the overall direction of the market trend. With a knowledge of the market structure, a trader can better understand if the market, at the macro level, is in an uptrend, range-bound, or downtrend situation.
Bullish Market Structure
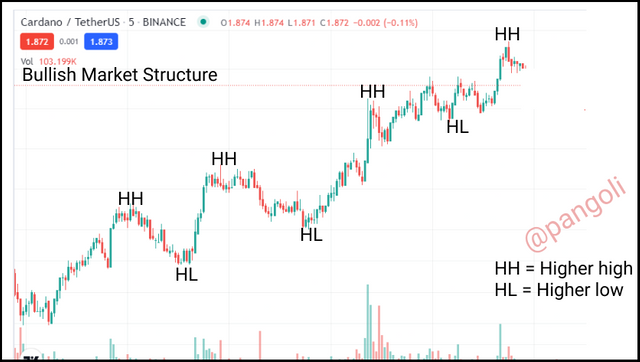
Screenshot
A market structure for an asset is described as bullish when the macro view of its price action is consistently making higher highs and higher lows.
As depicted in the image above, the Bullish market structure gives the trader an overall perspective of the market as bullish, so they can better differentiate between minor retracements and impulsive movements.
Bearish Market Structure
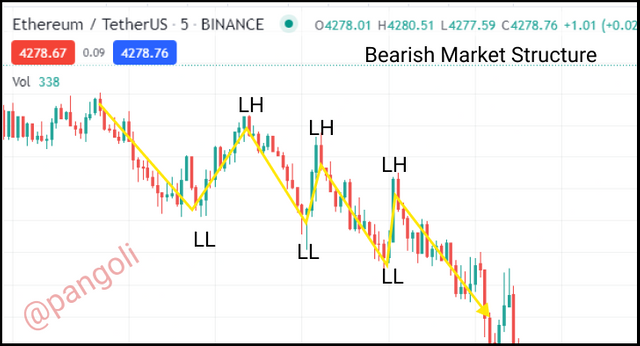
Screenshot
On the flip side, a bearish market structure entails that the overall view of an asset's price action tilts in favour of a downtrend. That is, the price action has made consecutive lower lows and lower highs, and is most likely expected to continue in that fashion for some time.
ii) Trendlines

Screenshot
Trend lines are simple straight lines drawn to connect the consecutive highs or lows of an asset's price trend to spot consistency and alert the trader should there be a break of structure.
When the market is in a downtrend, the trend line is drawn below the candlesticks to connect the respective higher lows. Also, when the market is in an uptrend, the trend line is drawn above the candlesticks to connect the respective lower highs.
It is always advised that traders make use of the numerous technical tools available to analyze the market and have a clearer view of price action.
Without tools that help to define market limits, key zones, and market structure. It might be a lot more difficult for traders to spot when the market trend has changed.
Technical tools like Trend lines help traders with a proper guide on the direction of the market trend, as well as signal them when the market structure is no more in favour of a particular direction.
Trend continuation: how to spot them using market structure and trendlines
It is a known fact that the market does not continue persistently without interruption in a particular direction. There would be a lot of imbalance if the market were to proceed in that fashion.
Hence, just like a typical human in a marathon race would pause to take a deep breath of air before taking on the next lap, there is always a point where the market takes a break from the prevailing trend to gather momentum for the next move. That point is generally known as a point of trend continuation.
Usually, without proper attention paid to the market structure at the macro level, a minor pull-back that would ultimately result in a trend continuation can be mistaken for a reversal signal. This is why it is expedient that traders have a good knowledge of market structure, and make appropriate use of trend lines.
Spotting trend continuation in a bullish trend
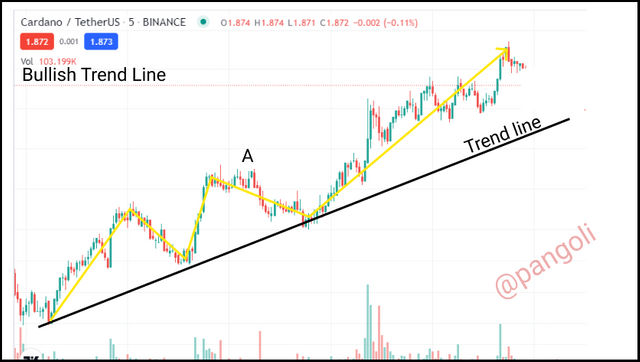
Screenshot
From the chart above, we can see that the market is trending upwards with consecutive higher highs. The trend line underneath is also in conformity as it joins consecutive higher lows.
At point "A" we can see the candlesticks consistently closing below the close of the preceding candles. By default, this could be regarded as a reversal signal - that the market trend is about to switch in the opposite direction.
However, a closer observation would reveal that the overall market structure is still bullish, and the trend line has not been defied. Hence, the trader can take a good position before the uptrend resumes again.
Spotting trend continuation in a bearish trend
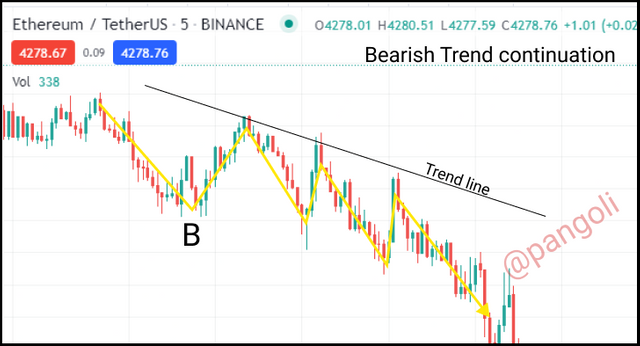
Screenshot
Similarly, we can see that the market here is in a downtrend with consecutive lower lows. The trend line above is also in conformity as it joins consecutive lower highs.
At point "B" we can see the candlesticks consistently closing above the close of the preceding candles. Normally, this could be regarded as a reversal signal that will cause the market trend to switch in the opposite direction.
However, a closer observation would reveal that the overall market structure is still bearish, and the trend line has not been defied. Hence, the trader can take a good position before the downtrend resumes again.
Illustration with real crypto-asset chart -
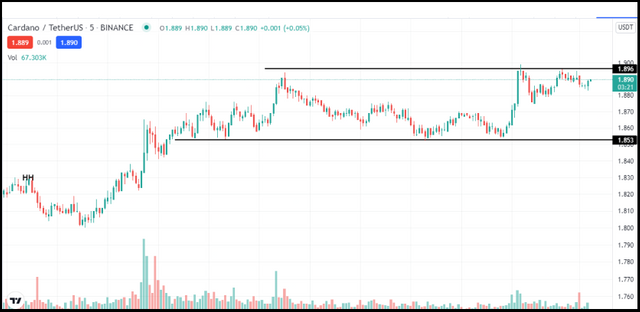
Screenshot
Presented above is the ADA/USDT chart. When observed casually, this chart could be erroneously read as an uptrend. However, a more careful introspection using appropriate analytical tools would reveal that is neither an uptrend nor a downtrend.
After drawing out the respective support and resistance lines, it is more visible that the market trend has not made any consistent higher highs, higher lows, lower lows, or lower highs. Instead, the price keeps bouncing repeatedly within a range.
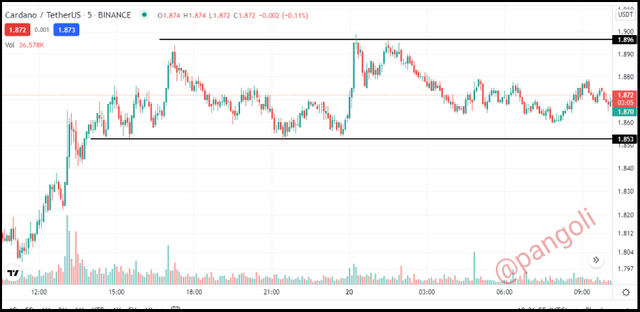
Screenshot
This is another screenshot of the ADA/USDT pair taken some hours after the first capture. This further confirms the fact that this asset is in a range-bound situation as the price keeps bouncing repeatedly within a particular range.
We can observe that price action has established three consecutive lows at the same point on the support line. Also, there is no noticeable higher high as the price keeps bouncing off almost immediately after touching the resistance line.
Conclusion
An understanding of key market concepts like trends and market structure is one basic skill that every trader should possess. And beyond the skill, it is plausible for traders to master the application of the same knowledge in the dynamic environment of financial markets.
When technical tools like trend lines are matched with a proper understanding of the market structure, and carefully applied in the analysis of financial assets. Not only does a trader stand a chance to make more profitable trades, but they also gain proper insight into any market signal and can differentiate a minor pull-back from a complete reversal.
Thank you for reading...

Hi there! If you read to this point, I am sure you enjoyed the article. Let's take this further, I'd like to connect with you on a more personal level. Feel free to hit me up on any of my social handles below:

Hello @pangoli, I’m glad you participated in the 1st week Season 5 of the Beginner’s class at the Steemit Crypto Academy. Your grades in this task are as follows:
Recommendation / Feedback:
Thank you for submitting your homework task.
Thank you for your review, professor @reminiscence01. However, my post is yet to be curated and we are approaching the end of another week.