Order Types and Risk Management in Trading
My own work
Definition of Trade Terminologies - Order types
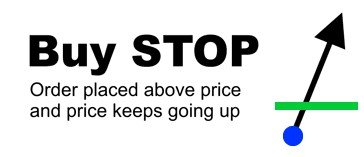
Buy stop
.jpg)
Image source
A "Buy-stop order" is a type of pending order set to be executed at a price that is above the current market price. Buy-stops are often placed when a trader has an overall bullish sentiment on the market.
It is often placed around a major resistance zone by traders, to enter the market when price does a bullish break-out from a major resistance. Put differently, traders that do not want to miss a breakout bullish rally often place Buy-stop orders to get their orders picked up upon a bullish. price breakout.
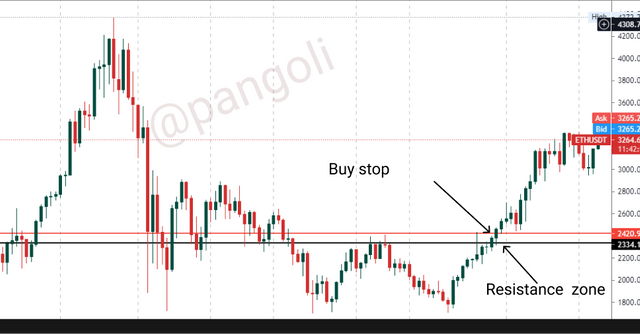
The chart below is an illustration of the "Buy Stop" using the ETH/USDT asset pair on the Tradingview app:
Image| Tradingview.com
On the chart above, we can see the Buy-stop price set just above the broken resistance zone.
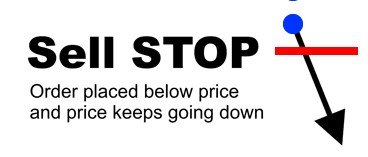
Sell stop
.jpg)
Image| Tradingview.com
Just like an opposite of the "Buy-stop," a "Sell-stop" order is a type of pending order set to be executed at a price that is below the current market price. Sell-stops are often placed when a trader has an overall bearish sentiment on the market.
It is often placed around a major support zone by traders, to enter the market when price does a bearish break-out below a major support zone. Put differently, traders that do not want to miss the bearish rally after a breakout often place Sell-stop orders to get their orders picked up upon a bearish. price breakout.
Below is an illustration of "Sell-stop" order on the ETH/USDT pair
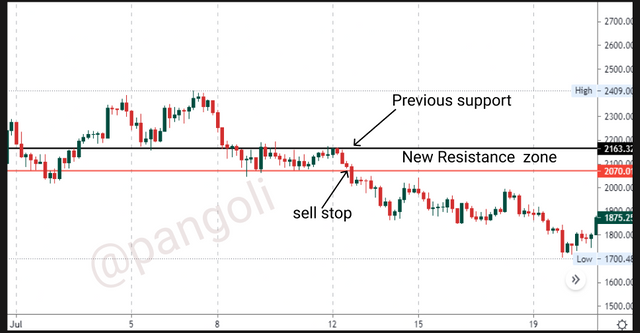
Image| Tradingview.com
On the chart, we can see the sell-stop order placed just below the new resistance zone.
Buy limit
.jpg)
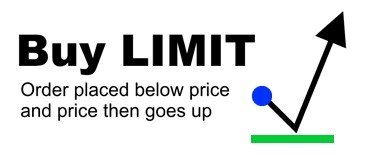
Image| Babypips.com
A "Buy" limit is a type of pending order set to be executed at a price that is below the current market price. Buy limits are often placed around major support zones by traders, to enter the market when a retest occurs after a bullish breakout. In other words, traders that missed a breakout move often place limit orders to catch-up during a price retest of major zones.
Here is an illustration of the Buy-limit order on the ETH/USDT pair using the Tradindview app:
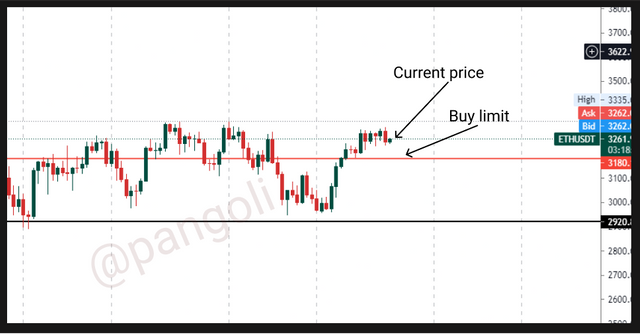
Image| Tradingview.com
The chart shows the Buy-limit order placed below the market price, in anticipation of a retest of the new support.
Sell limit
.jpg)
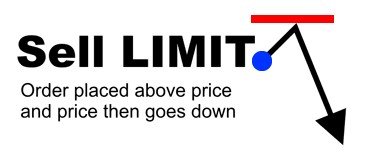
Image| Babypips.com
A "Sell" limit is a type of pending order set to be executed at a price that is above the current market price. This limit order is often placed around major resistance zones by traders, to enter the market when a retest occurs after a bearish breakout. The order is simply set such that it is picked up when price pulls back to the point at which the order is set.
Here is an illustration to demonstrate the Sell limit order on the ETH/USDT pair, using the Tradingview app:
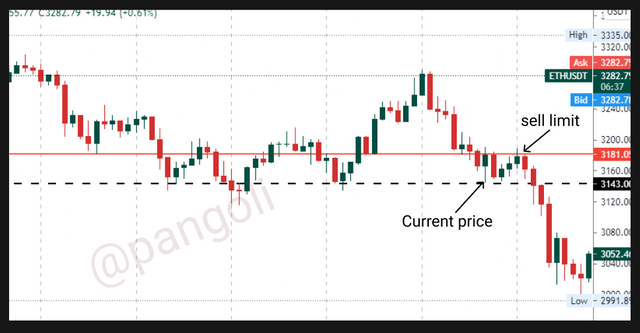
Image| Tradingview.com
The chart shows the sell-limit order placed above the current market price, in anticipation of a price retest on the new resistance zone.
Trailing stop loss
Oftentimes, traders do not want to exit a trade even after the trade has made some profits. This is usually because analysis on the trade still show signs of the market going in the expected direction for a little longer.
When this happens, traders tend to utilize the trailing stop loss strategy while still active in the trade. Using this strategy, a trader adjusts his stop loss level as price moves in the predicted direction. By doing so, they can move the stop loss order beyond their entry price; such that, they remain in profit even if the market reverses and hit their stop loss.
Margin call
A margin call can be seen as a reminder from a trade broker, notifying a trader that he has made much losses and do not have enough equity to continue holding a trade.
When traders take trades with margins, they borrow from the broker to increase their account leverage and make more profits if their trades go as planned. If eventually, trades do not go as the trader had predicted, the losses incurred are leveraged as well - That is, the losses are much more, when placed in contrast with a trade taken without leverage.
A Margin Call happens when a trading account does not have enough Free margin to compensate for the losses accumulated from open positions.
Free Margin = Equity - Used Margin
When the Used Margin is equal to, or greater than Equity, it means that there is no Free margin, and open trades can no longer be sustained. Hence, a Margin call is triggered. When a margin call happens and losses persist up to the margin stop-out level defined by the broker, traders' open positions are automatically closed.
Usually, after all open positions are closed, the trader incurs losses which can be calculated as follows:
Realized Loss = ((Closing Balance - opening balance)/Opening balance) x 100
Risk management in Trading
Risk management

Image source
Every trader in the Financial Market is in it to make some extra bucks. People naturally suck at loosing, and no one ever has it as a goal to make losses on trades. However, the Financial Market in itself has a highly volatile nature, with cryptocurrencies being one of the most volatile assets traded in it.
Price predictions on crypto assets cannot be made with a 100% certainty for a success. Hence, there is a need to minimize the chances of amassing losses through proper Risk Management.
Risk Management simply refers to the methods employed by a trader to minimize losses by maintaining a pre-determined risk-reward ratio. In order words, as the trader aims to win more trades with the signals he has gotten from numerous analysis, it is also safe to manage losses in case the market goes contrary to expectations.
Different approaches to risk Management
Trade planning
A proper trade plan is an essential risk mitigation measure. Planning a trade involves doing a sufficient back-testing on strategies with a demo account first, and engaging real funds only after the tested strategy has delivered good results for a good number of times.
Risk tolerance level
Having a defined risk tolerance level set before trade starts running, is a very important risk management approach. It involves understanding how much a trader would be willing to lose if the market doesn't go as expected. Therefore, a risk-reward ratio is used to define a trader's risk tolerance level.
For some traders, they can only afford to lose 1% of their total equity if trades do not go as planned. There are others who can risk up to 5% of their total equity because they have higher risk tolerance.
Stop loss orders
Stop-loss orders are set to hedge against making huge losses if the market goes against a trader's prediction. Simply put, it is an automated way for traders to exit trades when they have lost some pre-set amount in a bad trade.
A stop-loss order is usually set in line with the risk tolerance percentage. For instance, if a trader can only risk 2% of equity on any trade, the stop-loss order will be set at a price equivalent to a 2% loss in equity.
Take profit
The Financial Market is known for making very random movements. The possibility of having trades run into profits and revert back to losses is high. Hence, there is a need to set a profit limit on which trades can be automatically terminated. That is, a trader can have his profit target set, and the market automatically closes his trade when the price hits the profit target.
Trailing stop-loss orders
This is just like a variation of the stop-loss order. It used by traders to lock in profits without exiting the trade. Using this technique traders adjust the stop loss level as the trade goes in the desired direction, such that, they lock in some profits with every adjustment while still actively following the trade.
Demonstrating Risk Management with the Moving Average trading strategy
To demonstrate risk management using the Moving Average trading strategy, we will first add the Moving average indicator to our chart window using the steps below:
Note: I will be adding two moving average indicators, the 9-period Exponential Moving Average (EMA) and the 50 period EMA. This is because moving averages work better when combined across different periods. Also, the EMA was chosen because it's lag time is much lesser.
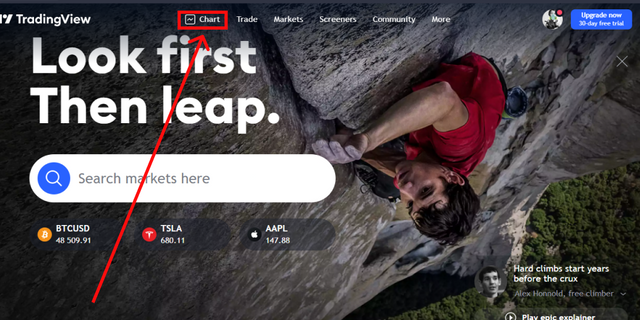
Step 1
.png)
Image| Tradingview.com
Launch the TradingView platform and open the chart interface by clicking charts at the top of the screen
Step 2
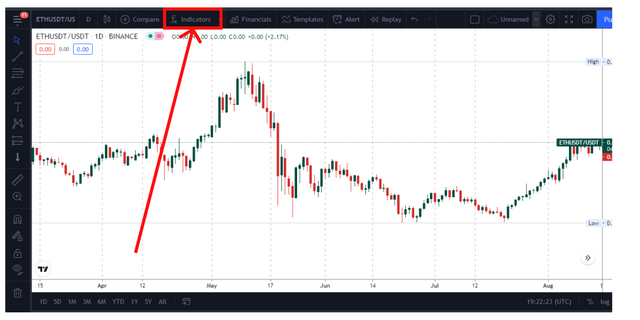
Image| Tradingview.com
On the chart interface, click on the indicator icon displayed at the top of the screen
Step 3
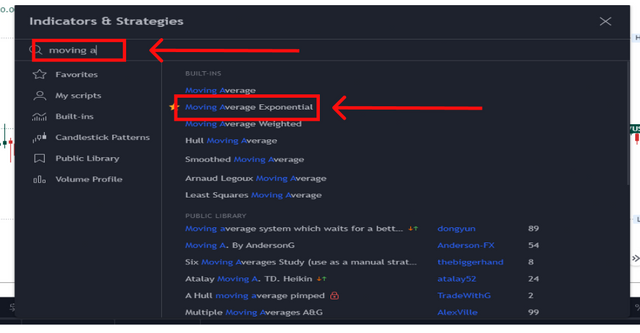
Image| Tradingview.com
Type "Moving Average" in the search box and click on the "Exponential Moving Average -EMA"
The indicator gets automatically added to the chart screen
To edit the default settings of indicator
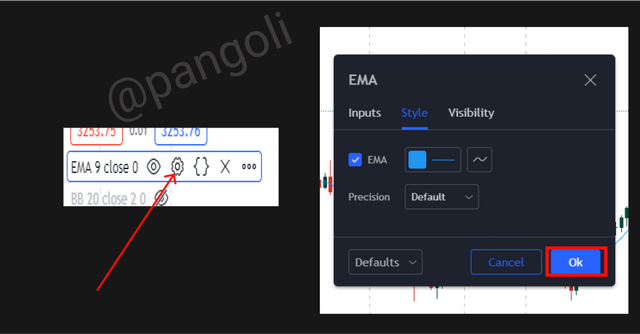
Image| Tradingview.com
- Click on the settings icon on the tools bar
- A menu will appear with options to format the indicator. Effect the desired changes and proceed.
The changes will appear on chart window. I left mine as default.
Image| Tradingview.com
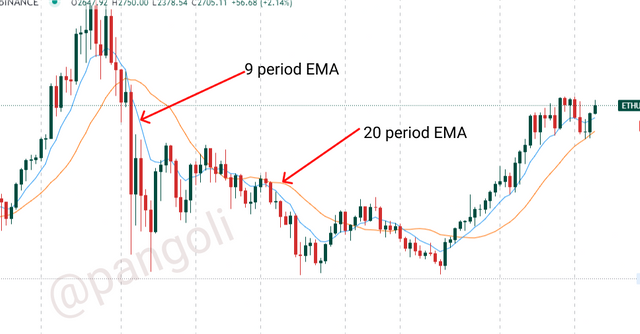
Here is what my chart looked like after adding the 9-period and 20-period EMA.
N/B: Repeat the same process from Step 1 above to add a 20 period EMA to the chart as well.
Illustrating Risk Management Moving Average trading strategy
Although Moving averages (MA) are lagging indicators, they are very useful in spotting proper entry and exit points in the market. When combined with price action, MAs can be a good confirmation to any signal suggested by an assets historical price action.
Following the market signals from a combination of different period's moving averages, a trader can easily identify when a market trend is about to change; and in conjunction with price action analysis, the trader can better decide whether or not to initiate a trade.
A Practical Example
Using an account size of $100 to trade the Eth/USDT pair on a daily timeframe. Analysis has shown that the market has bullish potentials.
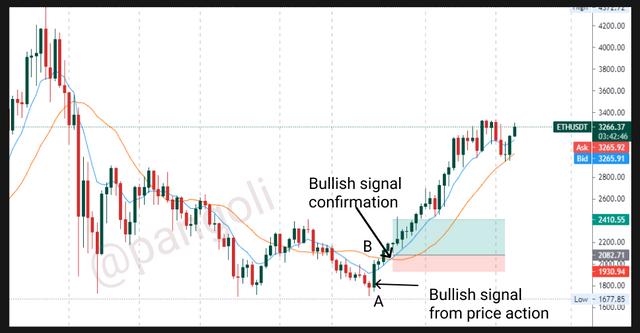
Image| Tradingview.com
From the chart, the price action had given off a bullish signal at point "A," and the moving averages confirmed same at point "B". Hence, to properly manage risk while taking a trade after the moving average golden cross, I have set my risk limit to 2% of my account. That is, in a situation where my trade doesn't go as planned, I would lose 2% of my account equity.
2% of 100 = (2/100) x 100
= $2
With this knowledge, my trade set-up is as follows:
- Entry price = $2082
- Stop loss = $1930
- Take profit = $2410
- R/R = 2.16
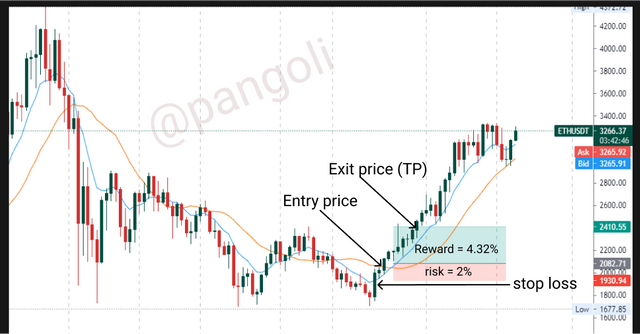
Image| Tradingview.com
From the set-up of this trade, I have a risk-reward ratio of 1:2.16. That is, if my trade favours me, my account balance will grow by $4.32; and if my trade goes against me, my account balance will decline by $2.
Conclusion
The role of proper Risk Management in financial market trading cannot be overemphasized. It is one of the easiest ways to avoid getting one's equity wiped out by unimaginable losses.
Utilizing proper Risk management strategies like Proper trade planning, Stop-loss orders, Take profit orders, Risk-reward ratio, etc., can help traders in the financial market maximize their earnings and reduce the possibility of getting liquidated.
Thanks for reading...

Hi there! If you read to this point, I am sure you enjoyed the article. Let's take this further, I'd like to connect with you on a more personal level. Feel free to hit me up on any of my social handles below:

Please stop tagging @steemcurator01 & @steemcurator02.
Hi
Thanks for participating in the Steemit Crypto Academy
Feedback
This is excellent work. Well done!