Crypto Academy / Season 3 / Week 7 - Homework Post for Professor @yousafharoonkhan
My own work
Hello everyone...
It's been another amazing week of lecture with Professor @yousafharoonkhan, lecturing about TradingView platform. I have learnt very practical lessons and discovered new tools in the process, most of which I'm already deploying in my market analysis process.
It was indeed a value-packed lecture, and the homework task helped solidify the knowledge. I have my entry for the homework task detailed below. I hope you get value as you read through.
Q1: Defining the TradingView site and how to register an account in tradingview? what are the different registration plan?(screenshot necessary)
TradingView has overtime been understood to be a charting tool for traders of the Financial markets. However, there is more to the TradingView platform than it being just a tool for technical analysis.
According to tradingview.com, trading view is a social network of over 30 million traders and investors using the world's best charts and analysis tools to spot opportunity in global markets.
The TradingView platform is mostly used by traders for technical analysis of assets price action. It's simple and user-friendly interface makes it easy to navigate; and with some technical built-in functions that makes it a very good charting tool for both new and experienced traders.
In addition, TradingView offers a community for both new and experienced traders to network and share ideas on their social media space. Chats can be initiated in real-time with traders from around the world and traders can broadcast their trading activity live, or publish analysis as a video idea.
How to register an account on TradingView
The process of registering an account on the TradingView platform is summarized in the following steps:
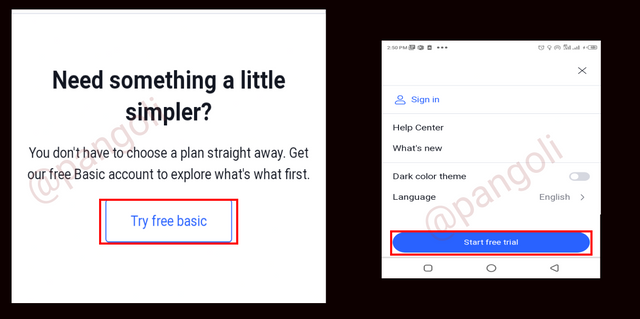
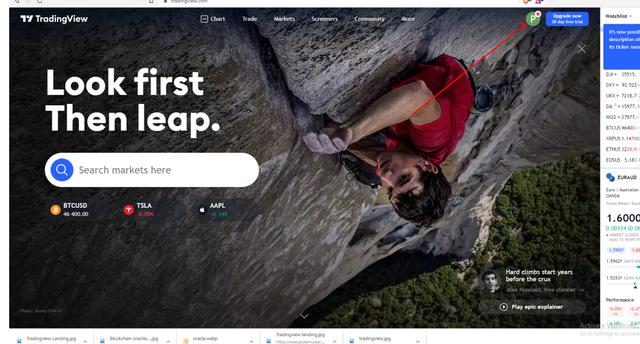
- Visit tradingview.com and click on start free trial on the extreme right corner of the screen.
Screenshot| Tradingview.com
- Scroll to the bottom of the resulting screen and click on the "Try free basic" button to open a free account.
Screenshot| Tradingview.com
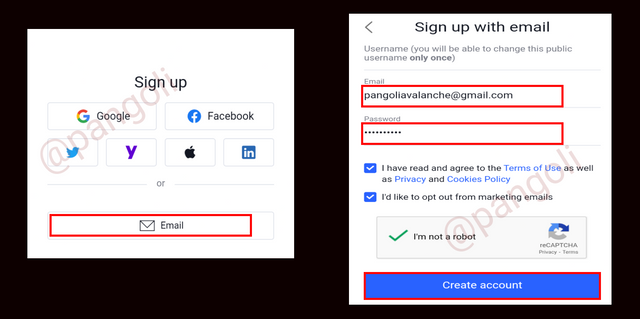
- Use any of the options to sign up. I chose the email route
- Input your information on the resulting form and click "Create account".
Once you click on "create account," your account will be created and an activation email will be delivered to the email you signed up with. Click the activate button in the email to activate your account.
Screenshot| Tradingview.com
Now your free account has been successfully created and activated. You can proceed to explore the TradingView platform and proceed to using the tools available on it.
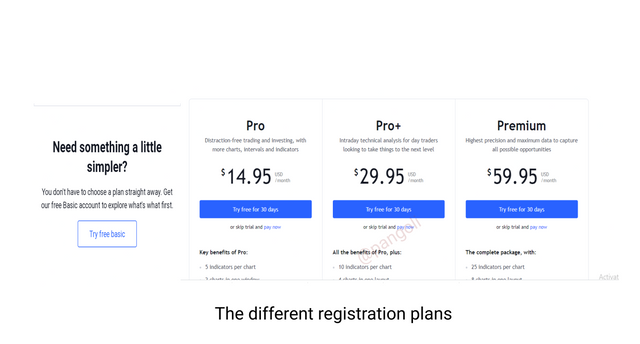
The different registration plans
 Screenshot| Tradingview.com
 Apart from the free basic account that I have just signed up for in the explanation above, there are some other paid-for registration plans with features distinct from the free version. The various registration plans on the TradingView platform are explained below:
- Free Basic
- Pro
- Pro+
- Premium.
We will explore these plans in the following explanations:
- Free Basic registration plan
This is the least of all the registration plans available on TradingView. It is free to sign up, and open to all who have successfully done an email registration on the TradingView platform. However, the free basic account comes with restrictions on some features. For instance, there is a limit to the number of indicators that can be added to a single chart.
- Pro registration plan
One can choose to sign up for a paid plan, or upgrade to a paid plan from the free basic plan. The pro registration plan has a subscription fee of 14.95 USD per month, and it more features compared to the basic plan. With the pro plan, users can add up to 5 indicators on a chart, as well as open up to 2 charts in a window. The single interesting feature of this plan is that there are no ads to disturb the trader's process flow.
- Pro+ registration plan
The Pro+ registration plan comes with higher benefits when compared to the previous two -free basic and Pro account. The Pro+ registration plan has a subscription fee of 29.95 USD per month. Some benefits unlocked in this plan include;
Maximum of 10 indicators on a chart
Up to 4 charts in a single window
100 server-side alerts
Traders have the leverage to work with 2 devices at a time.
As earlier stated, this plan can be subscribed to at the point of sign up, or through an upgrade from a lower plan.Premium registration plan
The premium registration plan stands as the highest available plan on the TradingView platform. With a subscription fee of 59.95 USD, the premium plan has the most features to explore when compared to the previous three plans. Some benefits on the Premium plan include:
- Up to 25 indicators per chart
- Maximum of 8 charts in a single window
- 400 server-side alerts
- User has the leverage of using 5 devices at a time, etc.
This plan, as well, can be subscribed to at the point of signing up, or through an upgrade from a lower account.
Q2: Explain the different features of tradingView and what is your favorite feature and why?(screenshot necessary)
Screenshot| Tradingview.com
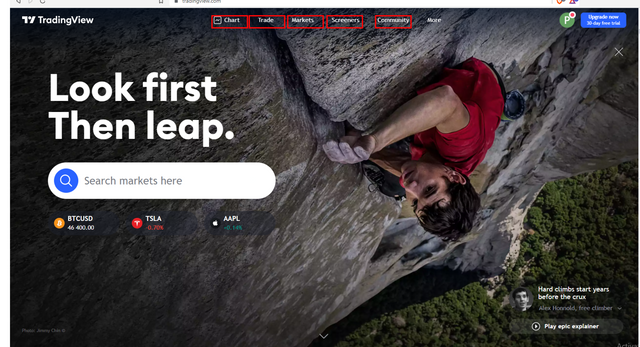
TradingView platform has several features that make trade analyses and market visualization more appealing to traders. The main features include:
-Chart
-Trade
-Markets
-Screeners
-Community
These features reveal some broader breakdowns in their respective categories which are discussed below:
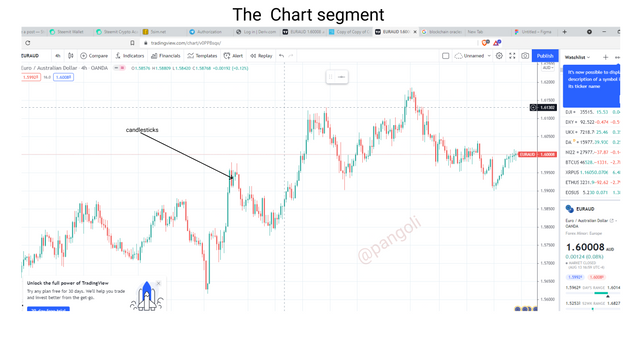
1. Chart
Screenshot| Tradingview.com
The chart segment displays an interface that summarizes market data in more appealing visual display. Market data is summarized in a chart made of bars, lines or candlesticks, and displayed in this section. The chart is a useful tool for technical analysis as it enables traders to see the behavior of an asset's price over time.
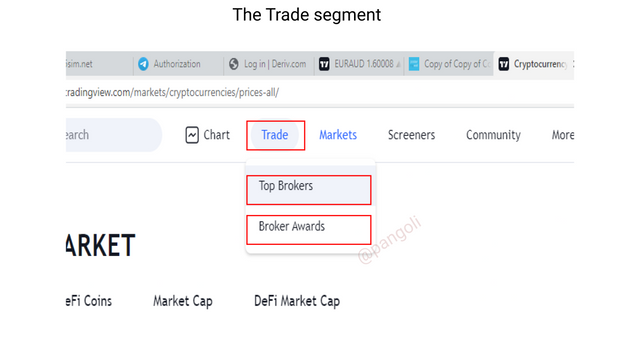
2. Trade
Screenshot| Tradingview.com
In the trade tab, users get to trade directly on the platform through supported, verified and user-reviewed brokers. That is, users do not need to leave the platform to Exchanges before they execute their trade. With this feature, users can execute the signals from their analysis on the platform.
3. Market
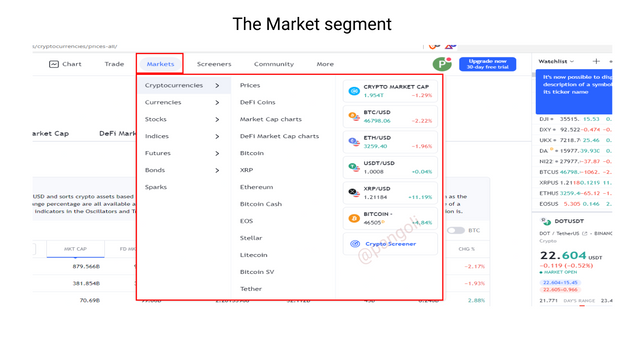
Screenshot| Tradingview.com
The market segment contains a list of Financial market assets available on the TradingView platform, ranging from cryptocurrencies to traditional market stocks. These assets have their live data fed to the platform in real-time.
4. Screener
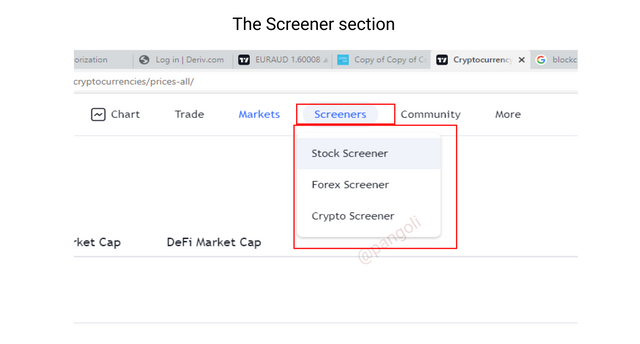
Screenshot| Tradingview.com
This category displays data on available assets on the platform labels with options to filter them through Overview, Performance, Oscillators and Trend-following. With this, a user can screen certain assets across all financial markets like Stocks, Forex and Cryptocurrencies by checking their performance and other matrices on the screener tab.
5. Community
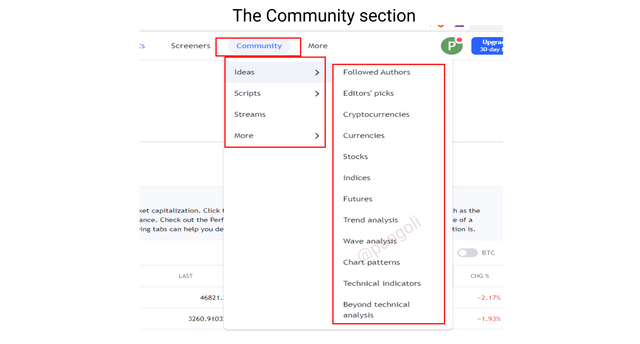
Screenshot| Tradingview.com
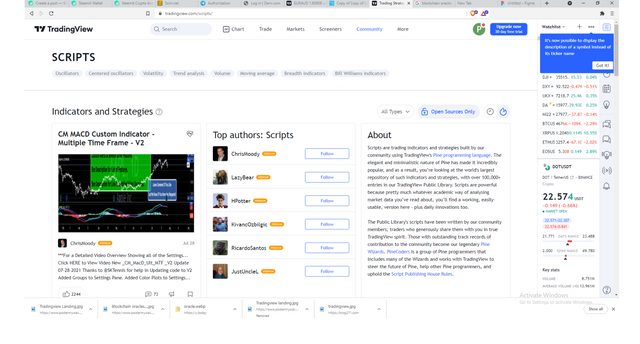
This feature leads a user to the TradingView community of traders. As a social network for Financial market traders, the TradingView platform provides a medium where users can follow different traders and access information through their publications. This feature has some sub-categories which include: Ideas, Scripts, and Streams from other traders on the network.
My favourite feature and why
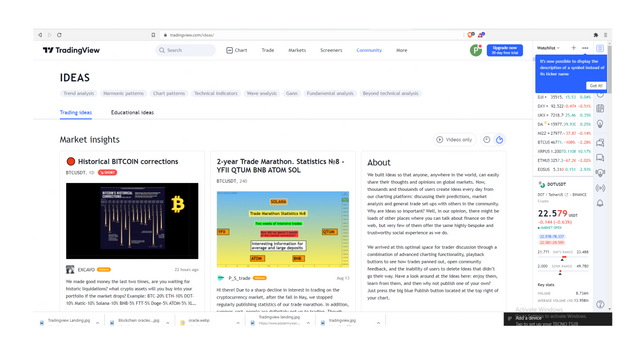
Screenshot| Tradingview.com
My favorite feature on the TradingView platform is the community tab. This is because it gives new and experienced traders the platform to network and share ideas.
Having access to the right platforms to gain practical knowledge of the Financial markets has been a great challenge for many persons over the years. With the TradingView social community, it becomes easier to access knowledge from traders who are already playing in the field with proven results.
Screenshot| Tradingview.com
With a feature like script, users of the platform get make use of the trading strategies programmed and published by other users of the platform.
Screenshot| Tradingview.com
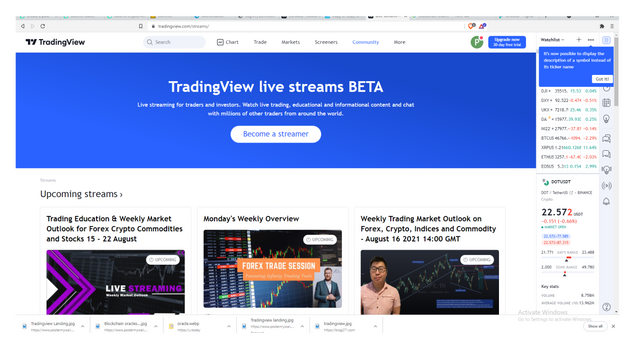
Chats can be initiated in real-time with traders from around the world. Also, through the live streaming feature on the social platform traders can broadcast their trading activity live, or publish analysis as a video idea.
Q3: How to set up a chart in TradingView and use two tools to edit it.(screenshot necessary)
Setting up a chart on TradingView takes some simple steps as follows:
- Visit tradingview.com and click "charts" on the landing page.
You will be redirected to the chart interface
Screenshot| Tradingview.com
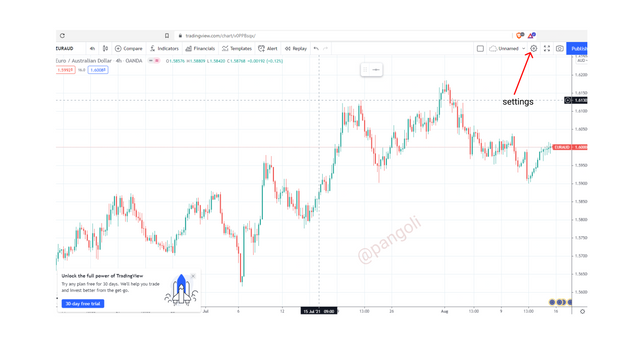
- On the resulting chart, click on the settings icon at the top of the screen
The settings menu is displayed with five (5) key categories:
- Symbol
- Status line
- Scales
- Appearance
- Trading
In each category, features exist to modify the chart parameters to suit trader's preference. We will explore these settings below.
Screenshot| Tradingview.com
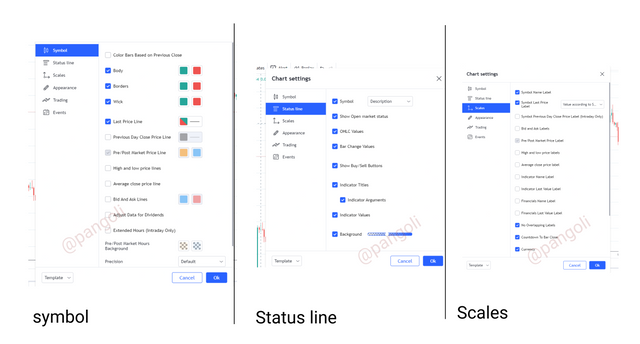
1. Symbol
In this category, changes can be made to the colors of candlesticks, as well as the color and density of price line markers. On my chart, I allowed the default setting here since I am already comfortable working with it that way.
2. Status line
Here, based on the trader's preference, changes can be made to options like: showing OHLC values, showing the buy/sell buttons, etc. You can choose the features you want on display by ticking the box.
3. Scales
In this section, we can activate features like : last price label, bid and ask labels, high and low price labels, etc., by ticking the boxes and they will be on display in our chart interface.
Screenshot| Tradingview.com
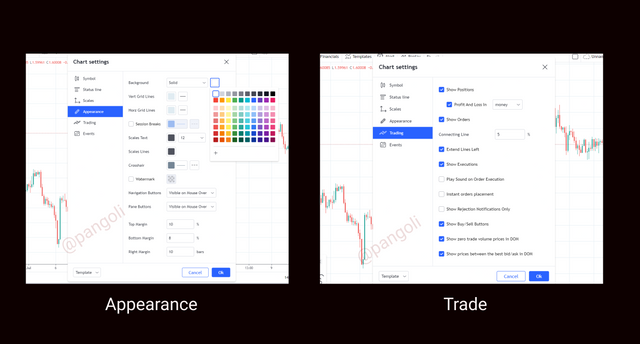
4. Appearance
Here, some basic formatting can be done to the visual appeal of the chart interface. Changes can be made to features like the background color and opacity, grid lines, text size and color, etc.
I still maintained my white background
5. Trade
In this section, settings around key trade matrices like positions, orders, etc., are made. Options whether or not to show these features exist, and upon clicking them, the trader decides on what should be on display on his screen.
Having explored and done the formatting in the five categories above, we can say that your market chart is ready for your use, just the way you like it.You can now choose an asset pair and relevant indicators from their respective tabs to proceed with your analysis.
Editing with two tools
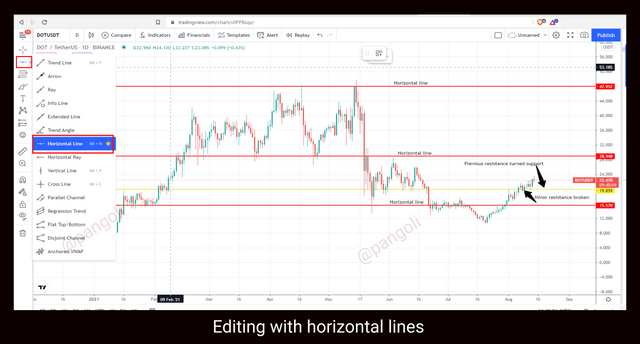
For this illustration, I will use the horizontal lines and the ruler on the DOT/USDT pair.
1. Horizontal lines
Screenshot| Tradingview.com
As seen on the screenshot above, I used the horizontal line tool to edit the DOT/USDT chart by mapping out its key support and resistance zones. On a daily timeframe, the pair has just recovered from a persistent downtrend. From the chart, it can be seen that the asset has pushed through a resistance zone, hence, settling at a new support.
2. Ruler
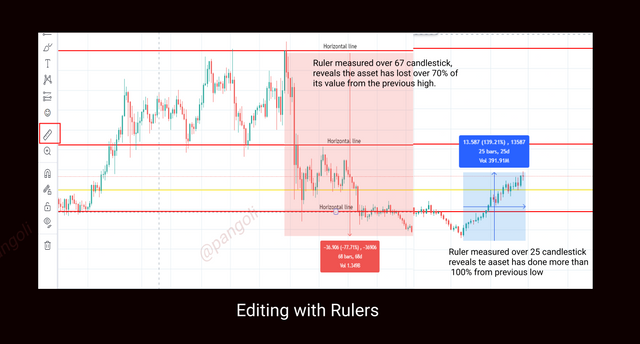
Screenshot| Tradingview.com
Although not a very popular tool, the ruler is effective in making measurements in the chart interface. It would be a tedious task trying to count the number of days the market has been on a down or Uptrend manually. With the ruler, the tool is simply drawn over a number of candlesticks and it produces the headcount results as well as percentage increase or decrease for the period covered.
From the chart, it can be seen that the asset pair initially had a 77% decline over a 67-day period, and subsequently did over 100% increase from it's recent low point within a period of 24 days.
Q4: Explain how to add indicator in chart, what is your your favorite indicator and why? (screenshot necessary)
For this illustration, I will add the Bollinger bands indicator to my tradingview chart using the following steps:
Step 1
Launch TradingView and click on Chart on the landing page
You will be redirected to the chart interface.
Step 2
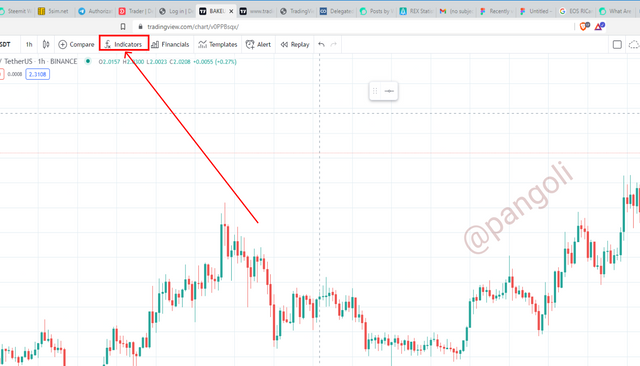
Screenshot| Tradingview.com
At the top left corner of the page, click on the "Indicator" icon as seen on the chart.
Once you click the indicator icon, a pop-up window will appear containing different indicators displayed in an alphabetical order.
Step 3
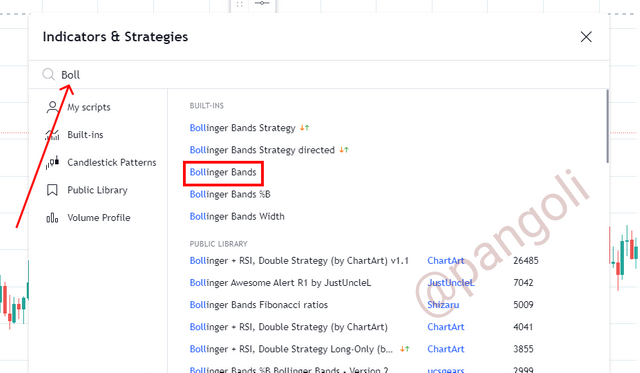
Screenshot| Tradingview.com
In the search box, type in the name of your preferred indicator and click on it from the resulting list. I chose the Bollinger bands indicator.
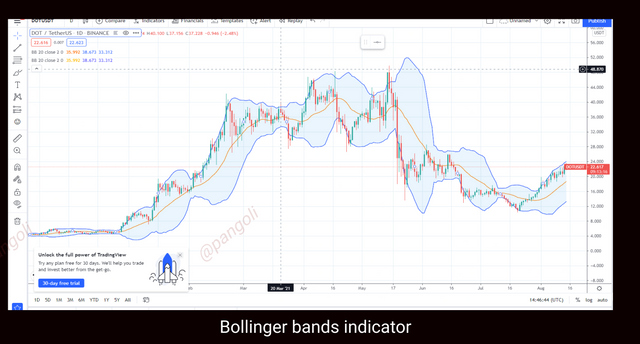
Screenshot| Tradingview.com
The Bollinger bands indicator get automatically added. The resulting chart has the Bollinger bands indicator wrapped around the candlesticks.
We can also attempt some modifications on the indicator if the default setting does not suit our preference. To modify the indicator, here are few simple steps to follow:
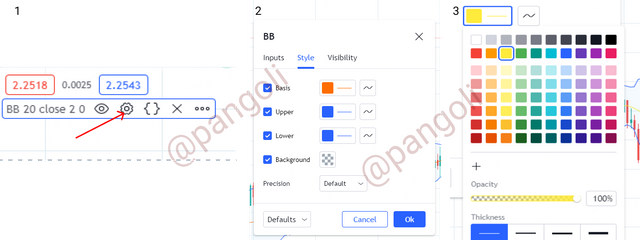
Screenshot| Tradingview.com
Click the settings icon (marked with arrow) on the indicator menu on the screen - Screenshot 1.
A pop-up window will appear - screenshot 2, showing different modification options for the indicator.
You can make changes to parameters like color, opacity, density, etc. I changed the colors and density of my Bollinger bands.
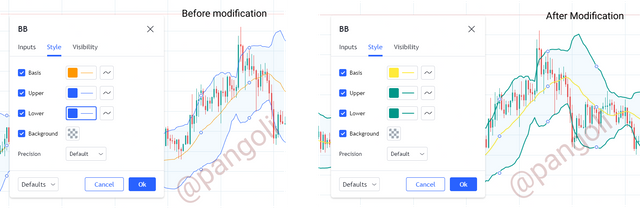
Screenshot| Tradingview.com
Here is the result of my chart after the modifications are done.
My favorite indicator - Bollinger bands
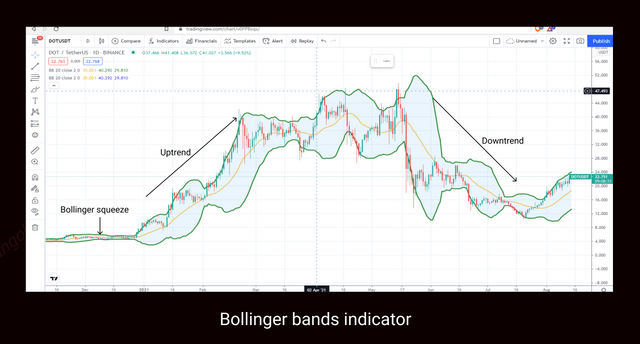
My favorite indicator is the Bollinger bands. Bollinger bands indicator is made up of a Simple Moving Average line (SMA) -the middle band- and two trend lines plotted at two standard deviations from the SMA - the upper and lower bands, respectively.
Why I chose the Bollinger bands indicator
Screenshot| Tradingview.com
Bollinger bands indicator is a well-rounded market indicator. It gives information on a wide range of market indices like:
-Trend direction
-Trading volume of an asset
-Trend reversals/continuation
- Breakouts, etc.
Using the Bollinger bands indicator, it can easily be spotted when the market is in an up or downtrend. Also, the distance between the upper and lower bands can lend insights on the trading volume of the particular asset pair.
In some cases, the Bollinger bands act as dynamic support and resistance zones. When coupled with candlestick price action and other relevant indicators, this could be a crucial factor in spotting out the various inflection points in the market. Bollinger bands can help a trader identify when a
possible trend continuation or reversal will occur.
Screenshot| Tradingview.com
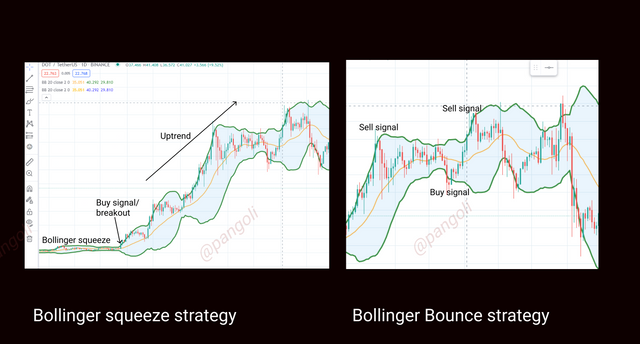
Also, the Bollinger bands indicator is a flexible market indicator that delivers strategies in all market situations. For instance, the Bollinger bounce strategy can be applied to trade profitably in a trending market or a range-bound market with high trading volume. While the Bollinger squeeze strategy can be applied in a range-bound market with low volume, preceding a breakout.
Q5: Do you think TradingView is useful in predicting the market for cryptocurrency (trend / price)?
TradingView is a very useful tool for market analysis. Given its unique feature as a charting tool and a social platform for traders, a user of the platform can access both fundamental and technical information about the market.
Fundamental and Technical information are some key matrices with which traders gain an insight into the future actions of the market. Through fundamental Information, a trader can form expectations on the market based on the information he has been exposed to.
Also, using the available tools on the platform, a trader can perform a comprehensive technical analysis on any asset pair and predict the potential future performance of such asset based on the results of the technical analysis.
Judging from experience, I do my charting and technical analysis using the TradingView platform, and to a very large extent, the market signals I pick up as a result of my analysis do play out.
It suffices to say that although TradingView is just a platform that provides sufficient tools for market analysis, it is very effective in predicting the Cryptocurrency market. A user can easily determine market trends using the numerous indicators available on the platform; and with that information, predictions can be made on price.
In summary, if the features available on the TradingView platform are properly utilized in Fundamental and Technical analysis, it can be very useful in predicting market trends and prices.
Conclusion
TradingView is one of the highly rated analysis tool for the Financial markets. With features suitable for obtaining both fundamental and technical information on the market, it has become very useful in market analysis.
When properly utilized, traders can gain a significant edge in the market by applying the insight gotten from the platform to their trading.
Thanks for reading...
Cc:
@youafharoonkhan
@steemitblog
@steemcurator01
@steemcurator02
Respected first thank you very much for taking interest in SteemitCryptoAcademy
Season 3 | intermediate course class week 7
your homework is well written and thank you very much for taking interest , keep continue good work , steem on