Reading Special Bar Combinations - Crypto Academy / S5W8 - Homework Post for @ sachin08
Hello steemians , Today i will represent about Reading Special Bar Combinations. Professor @sachin08 introduces this topic in detail as it becomes clear. Accordingly, you can read it clearly and complete the task with understanding.

Image designed by canva

01 Explain Price Bars in your own words. How to add these price bars on Chart with proper screenshots?
- Price bars.
Price bars are a method or way in which the trader can use to analyze everything that is happening with an asset. With a bar chart the trader has at his disposal valuable information that allows him to make decisions to trade.
A bar chart offers information about what is happening in real time, regarding the purchases and sales of an asset offering information about the opening price, closing price, maximum price and minimum price that an asset has managed to reach in a given period. defined period of time.
Opening price.
This is the price that the asset has at the moment the bar starts.Closing price.
This is the price with which the asset ends when the period of time established for the bar is fulfilled.Maximum price.
This is the highest price that the asset has achieved during the period of time that the bar lasts.Minimum price.
This is the lowest price that the asset has reached during the period of time that the bar lasts.

Add price bars to the chart.
To add the bar chart is very simple, basically we just have to choose that option we can see below screenshots.
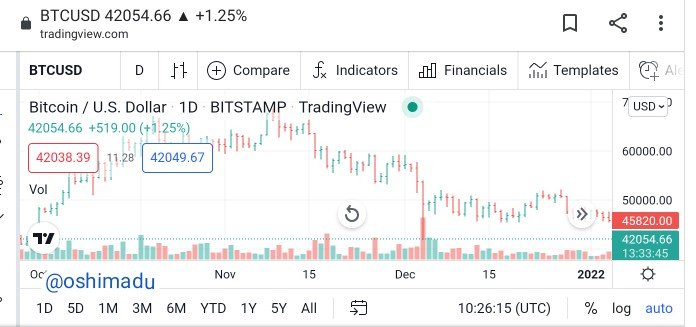
we can use the https://www.tradingview.com

screenshot by tradingview

screenshot by tradingview
After that we can see like this chart.
screenshot by tradingview
02 How to identify trends using Price Bars. Explain for both trend.
- Identifying an uptrend.
In a bar chart you should use the same central idea that we use with a Japanese candlestick chart. If we remember a bit the definition of what is an uptrend, we will see that an uptrend occurs when the price movement forms higher and higher minimums and higher than the previous ones.
Based on this, in a bar chart, we must identify closing prices and higher and higher maximum and minimum prices, if we are looking for an uptrend. As we already know, the price does not move uniformly, so we will also see some bars where the pattern of closing prices and higher minimum prices is not met.

screenshot by tradingview
An uptrend can be clearly seen in the image above. In the bars we can see how each bar surpasses its previous one in terms of closing prices and maximum and minimum prices since these in each bar are increasingly higher. We can also see that in some bars this pattern is broken and the closing, maximum and minimum prices are not higher, but this is perfectly normal, the important thing is that we can identify that prices always increase for two or three bars in a row. If, on the contrary, we observe that for two or three consecutive bars the closing, maximum and minimum prices fail to exceed their previous ones.
- Identifying a downtrend.
To identify a downtrend using the bar chart we use the same concept as above, but this time in the opposite direction. This means that we must identify in the bars, closing prices, maximum prices and minimum prices each time lower than their previous ones.
We must always try to identify that this pattern is fulfilled in at least two or three bars consecutively. As we have already said, it is normal to find bars where the pattern is not fulfilled and the closing, maximum and minimum prices do not manage to be lower than their previous one, but that is normal, although this is repeated for two or three consecutive bars we must take appropriate precautions as the trend is likely to change direction.

screenshot by tradingview
03 Explain the Bar Combinations for Spending the Day inside for both conditions.
Spending the day inside.(bearish)
• The previous trend was an uptrend.
• Then we can see how a bearish bar is formed whose maximum price is lower than the maximum price of the previous bullish bar. We can also see that this red bearish bar has a minimum price higher than the minimum price of the previous bullish candle.
• The bar pattern is then fulfilled by spending the day inside.
• Finally we can see how after this pattern the trend changes from bullish to bearish. With this I am not saying that this pattern is to predict changes in trends, but clearly this pattern indicates that there is indecision or struggle between buyers and sellers, so we must be alert to decipher how this struggle ends.

screenshot by tradingview
Spending the day inside.(bulish)
• It is observed that the previous trend was bearish.
• It can be seen how a small bullish bar is formed whose maximum price does not exceed the maximum of the previous bearish bar, but the minimum price of this small bullish bar is higher than the minimum price of the previous bearish bar. In this case, the pattern is fulfilled by spending the day in and then completing a change in trend from bearish to bullish.

screenshot by tradingview
04 Explain the Bar Combinations for Getting outside for the Day for both conditions.
outside day.(Bulish)
• An uptrend can observed in the market.
• Then we can see a bullish green bar whose opening price and minimum price are the same and also whose closing price and maximum price are the same. This situation tells us that buyers have total control of the market since there are no lows lower than the opening price and there are no highs higher than the closing price that indicate that at some point the bears made the price drop.
• later we can see how the upward trend continues and prices continue to rise.

screenshot by tradingview
outside day.(Bearish)
• The trend that can be seen on the chart is bearish.
• The opening price and the maximum price are the same. This may alert that at no time did the bulls have control of the price since we are in the presence of a bearish red bar.
• The closing price and the minimum price are the same. This allows us to see that the price remained strongly downward without encountering any major opposition from buyers.
• After all this, the price continues with the downtrend.

screenshot by tradingview
05 Explain the Bar Combinations for Finding the close at the open for both conditions in each trend.
close at the open.(Bulish)
• First we can see that the price was coming with an uptrend.
• Then we observe that there is a small retracement in the price movement.
• From here we can see two bars where the closing pattern is presented at the opening, which are indicated in the image.
• In both bars we can see that the opening price and the closing price are very close, but in turn these opening and closing prices end very close to the maximum price of the bar, which indicates that the upward trend could continue, as it actually happens.

screenshot by tradingview
Close at the open.(bearish)
• The price came from a previous uptrend that had ended with the price lateralization.
• During the period of price lateralization we can observe several bars where the opening price and the closing price were very close or almost the same. In turn, these opening and closing prices were very close to the minimum price of the bars. These bars are indicated in the image.
• The formation of these bars was telling us that the bears were slowly taking control of the market.
• In the end we can see how the price ends with a very strong bearish movement.

screenshot by tradingview
Conclusion
After an in-depth study of the column chart, it can be seen that there are some very useful patterns for predicting the direction of the market price.
It is important to have some knowledge of how the bar chart works as this will help us to have more vision of the market and more tools for trading.The pattern of closing the bars at the opening seemed to be very good as it clearly shows when the candles are controlled and in the same way the prevailing price movement in the market.
Thanks.