The Steemit Crypto Academy Week 14 | Season 2 | - Homework Post for @fendit
ELLIOT WAVE THEORY
Wave theory securities Technical analysis of one of the main theory, by the American economist Elliott proposed (Ralph Nelson Elliott).
Some traders use it to analyze financial market cycles and predict market trends. Ralph Nelson Elliott (1871-1948), a professional accountant, proposed an analytical method in 1930 and believed that the trend of market prices had a specific pattern.
In 1938, Eliot published "The Theory of Waves", formally proposing this theory, and in 1946, his last major work "The Laws of Nature: Secrets of the Universe" gave the most detailed explanation.
Elliott wrote that "people are subject to regular processes, and calculations about human activities can be projected to a certain stage in the future. I am sure of this." The empirical validity of wave theory is still full of controversy.
The longest grand supercycle is a super-large cycle spanning 200 years, while the subminuette only covers the trend within a few hours. Regardless of the size of the trend, the fact that each cycle consists of 8 waves is constant.
The application of this theory is that when the stock price follows the main trend, it fluctuates in the order of five waves, and when it goes against the main trend, it fluctuates in the order of three waves. The long wave can last for more than 100 years, and the period of the second wave is quite short.
Correction and impulse waves
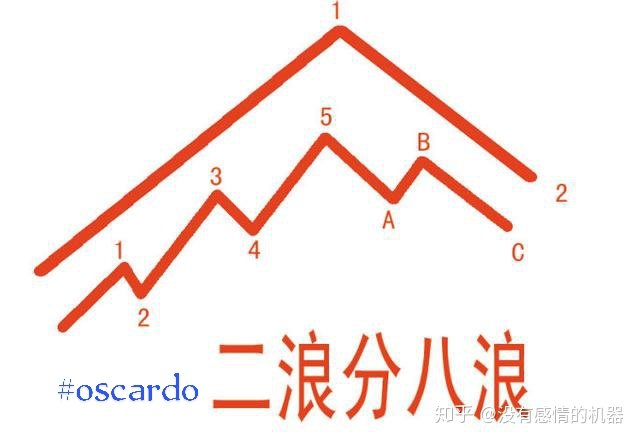
Figure 1: The two waves of Dow Theory and the eight waves of Wave Theory
As we all know, the Dow Theory puts forward the concepts of main trends and revised trends (waves 1 and 2 in Figure above).
Eliot refined on the basis of Dow's theory: a major trend and a revised trend constitute a complete cycle. The main trend is called the impulse wave and the main wave, usually composed of 5 small waves (1, 2, 3, 4, 5); the correction trend is called the correction wave, the secondary wave, which is composed of 3 small waves (A, B) , C), see the lower part of Figure above for details.
Note: The impulse wave does not necessarily refer to an increase, but also a decline; similarly, a correction wave does not necessarily refer to a decline, but can also be a rebound.
Furthermore, Eliot believes that whether it is a long market or a short market, each complete cycle will show a certain basic rhythm and pattern. In a cycle of the bull market, the first 5 bands are driven, and the last 3 are adjusted; and in the first 5 bands, the first, 3, and 5, that is, odd-numbered waves, are driving upwards (this is what we usually call The three legs of the bull market), the second and fourth, the even-numbered waves, belong to the adjustment decline.
In the short market, the opposite is true. Here, we can see: 1. The wave theory is composed of 8 waves; 2. There are two basic types of waves, namely propulsion wave 5-3-5-5-3-5 and adjustment wave 5-3-5 .
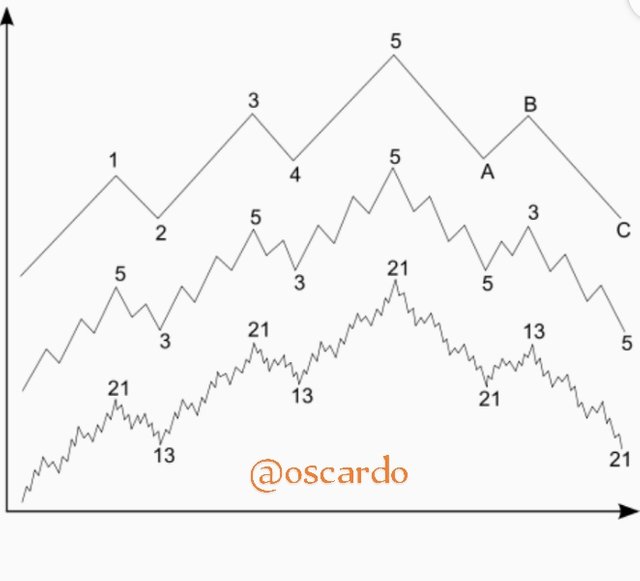
Waves can be subdivided. In other words, waves can be merged. An 8-wave cycle actually merges into waves 1 and 2 of a larger wave. It is precisely under the action of subdivision and merging that "the waves are in the waves, and they are endless", which constitutes the most attractive part of the wave theory.
Eliot's distinction between 8 waves
So, how should these 8 waves be divided? In other words, what are their respective characteristics that are easy to distinguish?
Elliott chose some specific terms to describe wave levels:
Extra large super loop level [I] [II] [III] [IV] [V] [A] [B] [C]
Super Loop Level (I) (II) (III) (IV) (V) (A) (B) (C)
Circulation class I II III IV VABC
Basic level I ii iii iv vabc
Medium level [1] [2] [3] [4] [5] [a] [b] [c]
Small class (1) (2) (3) (4) (5) (a) (b) (c)
Fine 1 2 3 4 5 abc
Among the eight waves, the main features are as follows:
The first wave: It represents the meaning of the market breaking out in despair. The rise of the first wave is usually not the largest among the five waves.
Wave 2: In the wave theory, this wave of decline is called a dangerous adjustment. Because market participants mistakenly believe that the bear market is not over, the magnitude of the adjustment is quite large, almost eating up the increase of the first wave.
Wave 3: The market moves forward in hesitation, matures in longing, and blue chip stocks and growth stocks have become the main theme.
Wave 4: The fourth wave is a correction wave after the market has risen sharply. It usually appears in a more complex pattern, often with a "tilted triangle" trend, but the bottom point of the fourth wave will not be lower than the top of the first wave.
Wave 5: The rise of wave 5 in the stock market is usually smaller than that of wave 3, and failures often occur.
Wave A: In Wave A, most market investors believe that the rising market has not yet reversed, and it is only a temporary retracement at this time.
Wave B: The performance of Wave B is often that the trading volume is not large, generally speaking, it is the escape line of bulls.
Wave C: It is a relatively destructive wave of decline. The decline is relatively strong, with a large decline, lasting for a long time, and there is a comprehensive decline.
After a movement, there must be an opposite movement; that is, the impulse wave and the correction wave follow like a shadow.
Coinchart for corrective and impulsive
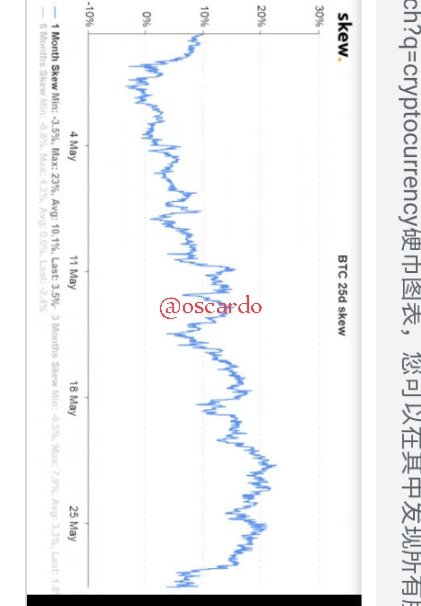
The impulse wave on the main trend has the same direction as the main trend, and can usually be divided into five lower-level waves; the correction wave is opposite to the main trend direction, or rises or falls. Usually can be divided into three waves of lower level.
Here, I personally think that there is no need to stick to these dogmas too much, as long as you use the same symbols for waves of the same level when marking waves.
Both waves are both trying to balance the equation on when the market assets are increasing and declining is because it will the investors know when,how and what to invest at any period of time.
Thank you for being part of my lecture and completing the task!
My comments:
Your work's not that good to me. It looks messy and explanations are not what I asked for.
As well as that, you didn't analyze a chart either.
Overall score:
2/10