The Steemit Crypto Academy Week 12 | Season 2 | - Homework Post for @kouba01
Relative Strength Index(RSI)
Relative Strength Index (RSI) analyzes the market’s buying and selling intentions and strength by comparing the average closing gains and average closing losses over a period of time, so as to make future market trends.ortunately, you don't need to know what the formula is or how it works in order to benefit from RSI.
For people with super knowledge reserves, this is:
RSI = 100-100 / (1 RS)
RS = average value during X period closed / average value during X period closed
X = 14 is recommended, but multiple transactions are possible The choice of
the person The formula returns a value between 0-100, which is represented by a waveform pattern (called an oscillator) in the graph.
When the RSI falls below 30.00, the asset is considered to be undervalued or "oversold" and a corrective rebound will occur. On the other hand, after the RSI is printed above 70.00, buying pressure usually fades, indicating an overbought situation.The best part about the relative strength index is its reliability, and the evidence is in the chart.
Can RSI be trusted on cryptocurrency trading and why?
Relative Strength Index (RSI)-one of the most widely used technical trading tools. This indicator is used to help determine when the price of an asset is too far away from its "true" value, allowing traders to profit before the market corrects itself.
With the help of RSI, traders are more likely to get a good trading entry, which makes it a valuable tool for trading in the volatile cryptocurrency market.RSI can help determine when assets cooling, if only a short period of time.
How do you configure the RSI indicator on the chart and what does the length parameter mean? Why is it equal to 14 by default? Can we change it?
By default, RSI measures price changes in 14 periods (14 days for daily charts, 14 hours for hourly charts, and so on). The formula divides the average gain of the price relative to the time by the average loss, and then sets the intensity to a range of 0 to 100.
As mentioned before, RSI is a momentum indicator, a technical trading tool that measures the speed of price changes. When the momentum rises, it indicates that the stock is being actively bought in the market. If the momentum drops, it indicates that traders' interest in the stock is slowing.
RSI is also an oscillatory indicator that makes it easier for traders to find overbought or oversold market conditions. In 14 cycles, it uses an index from 0 to 100 to evaluate asset prices. An RSI indicator of 30 or lower indicates that the asset may be close to its bottom (oversold), and an indicator higher than 70 indicates that the price of the asset is close to its high (overbought) during the period and is likely to fall.
Although the default setting of RSI is 14 periods, traders can choose to modify it to increase sensitivity (fewer periods). Therefore, the 7-day relative strength index is more sensitive to price changes than the 21-day index. In addition, short-term trading settings may adjust the RSI indicator to treat 20 and 80 as oversold and overbought levels (instead of 30 and 70), reducing the possibility of providing wrong indicators
(D). How do you interpret the overbought and oversold signals when trading cryptocurrencies?
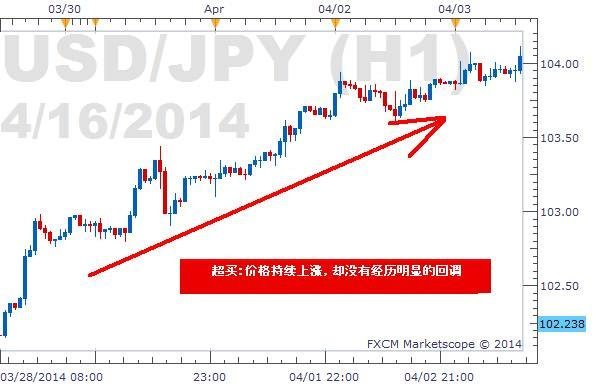
Overbought refers to the fact that prices continue to rise during a certain period of time, but they have not experienced a major correction. The picture below shows overbought, and the price almost rises from the bottom left to the top right in one breath. As shown in the figure below
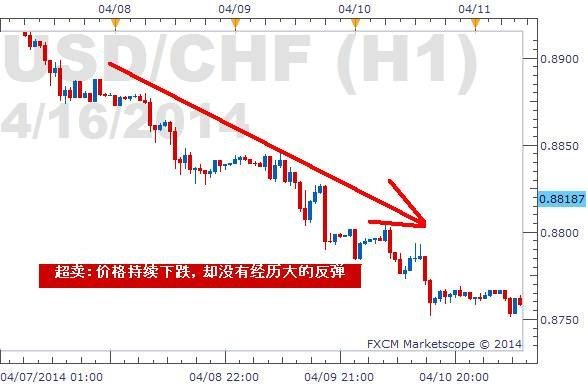
Oveersold refers to the continued decline in prices, but no significant rebound. From the picture, it is from the upper left corner all the way to the lower right corner. As shown in the figure below
Because the price trend cannot go all the way to the north or all the way to the south, the price will eventually reverse at a certain node, and the foreign exchange trend will also be the same. Overbought/oversold sometimes provides excellent contrarian trading opportunities. However, it should be remembered that in a trend, overbought and oversold conditions can last for a long time. Therefore, we need to use other technical analysis such as RSI indicators and KDJ indicators to help us determine whether the turning point has come.
" Overbought " and "oversold" extreme short-term stock price described, indicating that stock prices go too far in a particular direction. When a stock is classified as overbought in the market, it means that experts believe that its selling price exceeds its actual value. On the other hand, oversold stocks are stocks that analysts believe are trading at a price lower than their actual value.
Filtering RSI signals to recognize true signals from false signals
Stochastic RSI is a momentum indicator used to determine whether an asset is overbought or oversold. As the name suggests, it is a derivative product of RSI, which is generated based on RSI value rather than price data.
Usually, the random RSI value ranges from 0 to 1 (or 0 to 100).
Due to its faster speed and higher sensitivity, StochRSI can generate many incomprehensible trading signals. Generally, it tends to be most useful when approaching the upper or lower limit of its range.
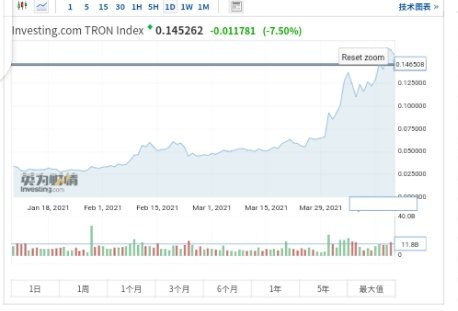
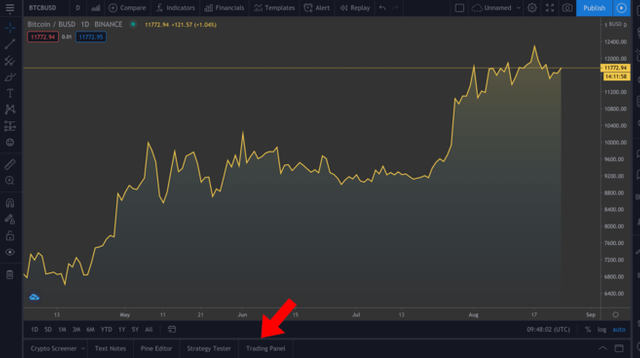
The chart of any pair (eg TRX / USD)
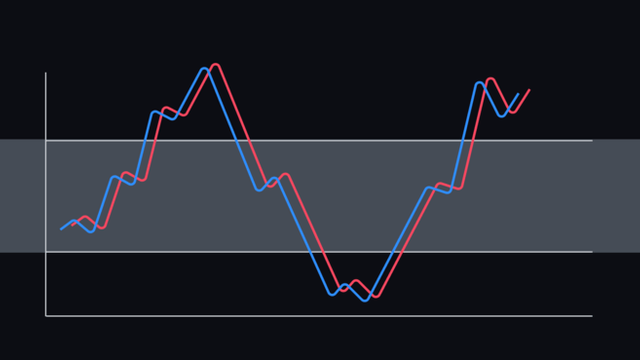
In order to clearly illustrate the important role of the relative strength indicator RSI in actual combat applications, we set the fast RSI as the 5-day indicator and the slow RSI as the 40-day indicator, so as to increase the distance between the two curves.
The RSI indicator is a very useful short-term market entry indicator. It can notify you to enter the market half a trading day and one trading day in advance, and the accuracy is quite high.
Unfortunately @oscardo, this week's submission time has expired.