Trading Crypto with Keltner Channels - Crypto Academy / S5W6 - Homework Post for @fredquantum
Hello everyone, this is season 5 week 6 of the steemit crypto academy. This week’s lecture was delivered by professor @fredquantum and the topic for discussion was Trading Crypto with Keltner Channels . After going through the lesson and understanding it I decided to try my hands on the given task.
1. Creatively discuss Keltner Channels in your own words.
The Keltner indicator is an indicator that is used to measure the volatility and momentum of crypto assets. The Keltner indicator is made up of three lines which are; the Upper band, EMA and lower band. These lines are arranged in a way that the Upper band is on top, the EMA in the middle and the Lower band found below them.
Chester W. Keltner is responsible for the invention of the Keltner channel indicator during the 1960s and later on in the 1980s it was modified and improved by Linda Raschke to be able to fulfill the demands of modern trading at the time.
When using the Keltner Channel indicator, the upper bands and the lower bands represent the volatility of the market. These upper and lower bands are set in a way that they double of the average true range (ATR) then the upper band is placed above the EMA whilst the lower band is placed below the EMA. The Keltner channel indicator will then identify the trends by taking into account some particular factors. Some of these factors include the price movement and the indicator angle, the breakouts and also the dynamic support and resistance areas within the chart.
In a case where we are using the Keltner channel indicator and the indicator angle seems to be making an upward movement and we can also see that the price is making a lot of higher highs and higher lows, we can conclude that the market is on an uptrend. On the other hand, when we are using the Keltner channel indicator and the indicator angle seems to be making a downward movement and we can also see that the price is making a lot of lower highs and lower lows, we can conclude that the market is on a downtrend.
The Keltner channel indicator will determine the direction of movement of the price when we follow the steps above carefully. When there is an uptrend we will see the indicator angle making an upward movement and then when there is a downtrend we will see the indicator angle making a downward movement. When there is a strong uptrend, we will see a break that goes above the upper band and similarly when there is a strong downtrend, we will see a break that goes below the lower band.

2. Setup Keltner Channels on a Crypto chart using any preferred charting platform. Explain its settings. (Screenshots required).
I will use the tradingview platform to set up the Keltner channel indicator. To do that we have to first into the Tradingview.com website. The page will open and then you press on the menu box and click “charts”. When the chat is opened, we can then add the cryptocurrency pair of our choice and then click on the Indicator option (Fx) which is after the top of the chart.
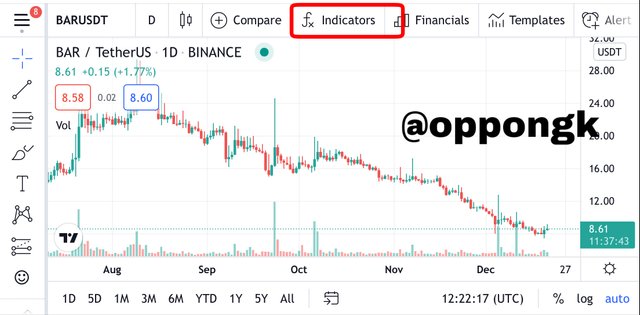
Screenshot from Tradingview
After that the search box will pop up and then we will Keltner Channels in it and then it will appear. This is shown in the screenshot below.
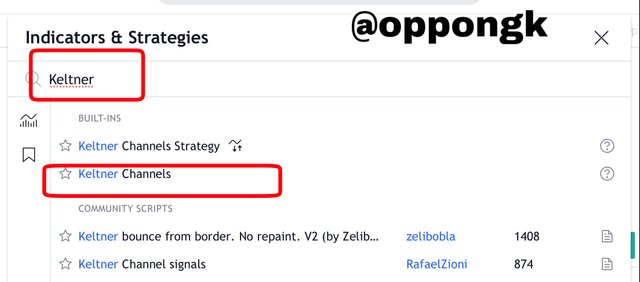
Screenshot from Tradingview
After this the Keltner indicator will be added to the chart as shown below.
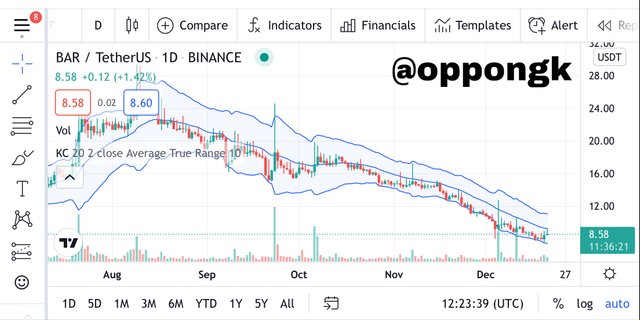
Screenshot from Tradingview
Now we can configure this indicator. To do this, we will click on the settings icon as shown in the chart below.
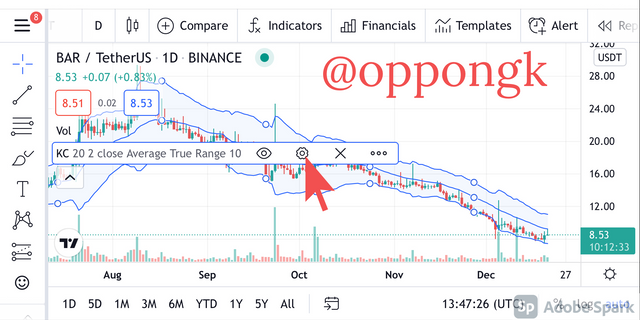
Screenshot from Tradingview
We then click on the input option and a section will open. In this section the default settings of the period and multiplier are 20 and 2 respectively. But we can change them to suit our trade.
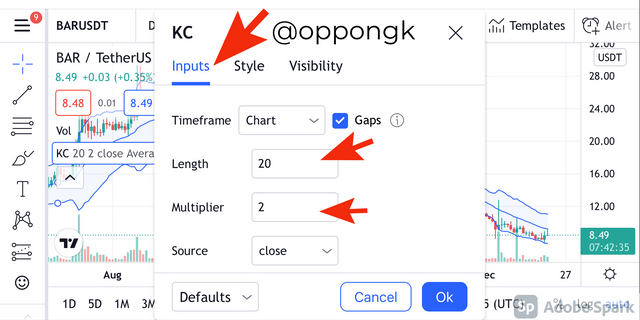
Screenshot from Tradingview
We can click of the style option to change the colour of the band lines. This is demonstrated in the screenshot below.
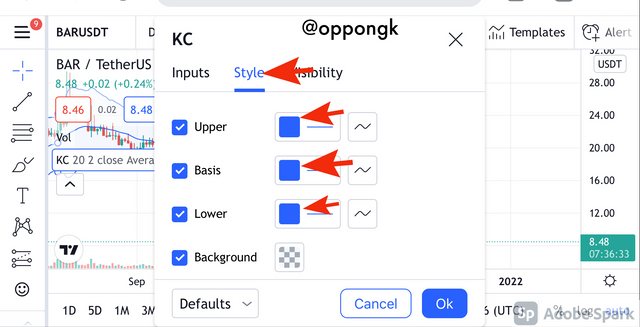
Screenshot from Tradingview
After we edit all these settings we press the OK button and the indicator is configured. The below screenshot shows the configured Keltner indicator on the chart.
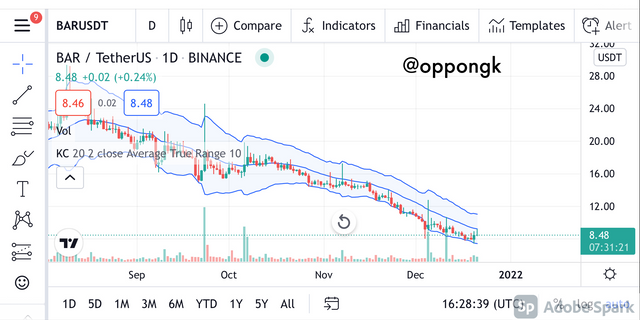
Screenshot from Tradingview
When we add the Keltner channel indicator, it has its own default settings. This default settings is at a period of 20 and the multiplier at 2. The ATR value is also set to 10 in the default settings. However, the best settings of the Keltner channel indicator depends on the type of trade we intend to take. A trader that wants to engage in a long term trade will use a longer period whilst a trader that wants to engage in short term trade will use a relatively shorter period.
So we can get the best of settings by combining it with other indicators or better still we can use backtesting as way of determining the best settings we should use.

3. How are Keltner Channels calculated? Give an illustrative example.
The calculation of the Keltner channel indicator can be expressed mathematically. We have a formula that is generally accepted for the Keltner channel indicator calculations. This formula is as follows;
Lower band = EMA - 2 * ATR
Upper band = EMA + 2 * ATR
EMA = The Middle line
The multiplier is a constant = 2
Illustrative example of calculating Keltner indicator
Let’s take a BTCUSDT chart which has these prices for the various components;
ATR = 10
EMA = 40
Multiplier is constant = 2
Now we can use these parameters to calculate for the lower band, upper band and the middle line.
Upper band = EMA + 2 * ATR
Upper band = 40 + (2*10)
Upper band = 40 + 20
Upper band = 60
Lower band = EMA - 2 * ATR
Lower band = 40 - (2 * 10)
Lower band = 40 - 20
Lower band = 20
The EMA is equivalent to the middle line.
Hence Middle line = 40
The calculations we made about will signal a bullish trend due to the fact that the upper band will be making an uptrend movement.

4. What's your understanding of Trend confirmation with Keltner Channels in either trend? What does sideways market movement look like on the Keltner Channels? What should one look out for when combining 200MA with Keltner Channel? Combine a 200MA or any other indicator of choice to validate the trend. (Separate screenshots required)
Using Keltner channel indicator for Trend Confirmation
We can use the positional angle of the upper and lower bands and the middle line of the indicator to confirm trends using the Keltner channel indicator. The below steps will be used to demonstrate this.
Uptrend Trend Confirmation
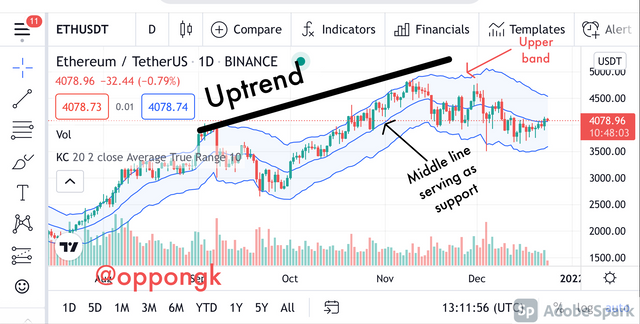
When using the Keltner indicator and we observe that the upper band, lower band and middle line makes an upward movement to form an angle and the price also keeps making higher highs and higher lows, we can conclude that there is an uptrend. When this happens we see the price positioned in the middle of the upper band and the middle line. In this case the upper band and the middle line turn to the resistance and support respectively. The chart below demonstrates this phenomena;
Screenshot from Tradingview
We can see that the Keltner channel indicator has confirmed that the trend is making an uptrend in the chart above. This is because the indicator forms an angle that is upward. We can also see that in most cases the price remains in the middle of the upper band and the middle line. The upper band and the middle line also serve as resistance and support respectively.
Downtrend Trend Confirmation
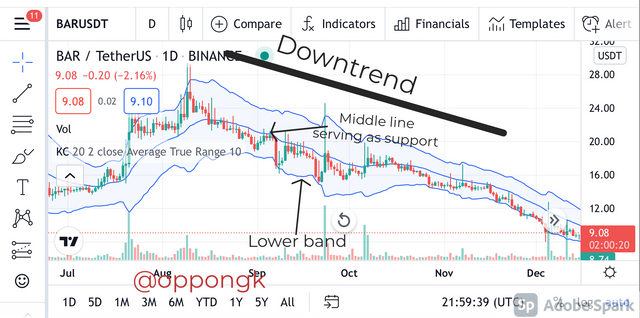
When using the Keltner indicator and we observe that the upper band, lower band and middle line makes a downward movement to form an angle and the price also keeps making lower highs and lower lows, we can conclude that there is a downtrend. When this happens we see the price positioned in the middle of the middle line and the lower band. In this case the middle line and the lower band turn to the resistance and support respectively. The chart below demonstrates this phenomena;
Screenshot from Tradingview
We can see that the Keltner channel indicator has confirmed that the trend is making a downtrend in the chart above. This is because the indicator forms an angle that is downward. We can also see that in most cases the price remains in the middle of the middle line and the lower band. The middle line and the lower band also serve as resistance and support respectively.
What does sideways market movement look like on the Keltner channels
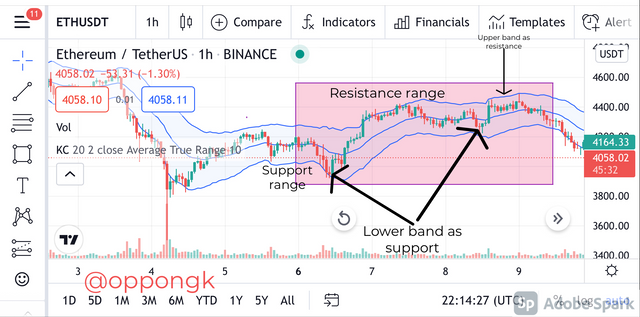
Unless a breakout occurs above the resistance level or below the support level, the price will keep moving within the premises of the support and resistance. This is what happens in the sideways market. A sideways angle movement is formed by the Keltner channel indicator during the time of the sideways market. In this case the upper band and the lower band represent the resistance and support respectively. This is demonstrated in the chart below
Screenshot from Tradingview
Looking at the chart above, we can see that the price trend still remained between the support and resistance level whilst the Keltner channel indicator made some sideways movement on several occasions. We can also see that whilst the upper band still served as the resistance and lower band served as the support, the Keltner indicator at some point began to act as a dynamic support and resistance level with respect to the movement of the price.
What should one look out for when combining 200MA with Keltner channel?
In using technical indicators during our analysis, it is very possible that these indicators will generate false signals. The Keltner channel is not an exception hence it is capable of generating false signals as well. To care for this, we can combine the Keltner channel with other indicators such as the Moving Average that can help in filtering out the false signals generated. 200MAis the period that is used for this section.
Lets look at the various observations we can make when we are combining the Keltner channel to the 200 Moving Average.
Uptrend
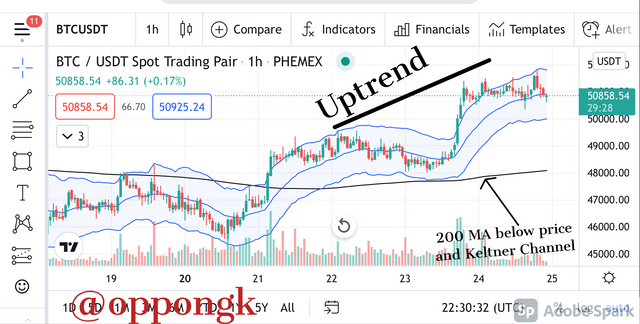
When doing analysis on the market, when will see that the will be moving upward to form an upward angle whilst the 200 MA remains beneath the Keltner channel and the price trend. When this happens it means there is an uptrend. After this we can conclude that the market is on a bullish trend.
Screenshot from Tradingview
Looking at the chart above, we can conclude that there was a bullish trend looking at the position of the 200 MA and the Keltner channel.
Downtrend
When doing analysis on the market, when will see that the will be moving downward to form a downward angle whilst the 200 MA remains above the Keltner channel and the price trend. When this happens it means there is a downtrend. After this we can conclude that the market is on a bearish trend.
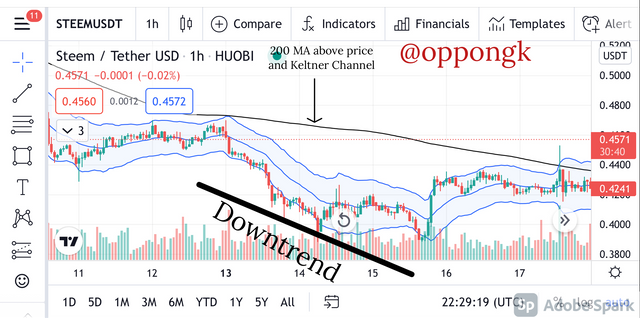
Screenshot from Tradingview
Looking at the chart above, we can conclude that there was a bearish trend looking at the position of the 200 MA and the Keltner channel.
Sideways Market
In a sideways market, the indicator usually confirms that there is no trend at that particular time. At this point the 200 MA can always be found within the Keltner indicator and the price trend. The support and resistance levels remain constant in this situation. The chart below is used to demonstrate this scenario.
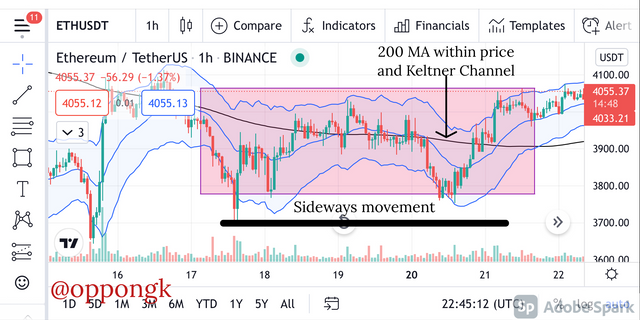
Screenshot from Tradingview
Looking at the chart above, the position of the 200MA and the Keltner channel confirms that there was no trend in the market at that time.

5. What is Dynamic support and resistance? Show clear dynamic support and resistance with Keltner Channels on separate charts. (Screenshots required).
These dynamic supports and resistances are different from the normal ones in the sense that the dynamic ones are made by the prices that make diagonal movements. The normal support and resistance are formed from the horizontal movement of prices but when the price moves diagonally, the dynamic supports and resistances are formed. These dynamic support and resistance can be detected by the use of some indicators such as the Keltner channel and moving average etc.
The upper band and the lower band of the Keltner channel can be used to determine the dynamic support and resistance. In this case we will use the upper band as the region of resistance whilst we use the lower band as the support region.
- Dynamic Resistance
We will demonstrate this using the below crypto chart. We can determine the dynamic resistance in the crypto chart below. The upper band is used as the resistance line and we can see that the price trend is moving within the resistance level and at the end the resistance level was finally broken and then it made a bullish trend
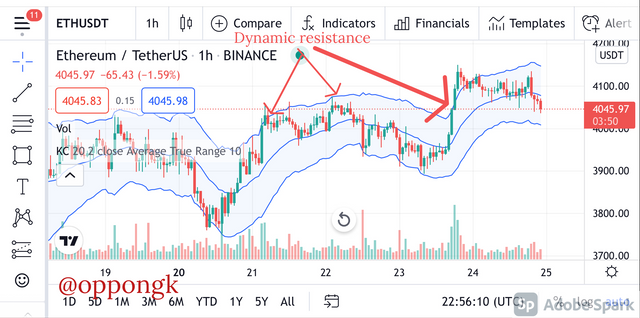
Screenshot from Tradingview
- Dynamic Support
Looking at the crypto chart below, the lower band acted as a dynamic support as the price is failing to break below the lower band of the Keltner channel indicator.
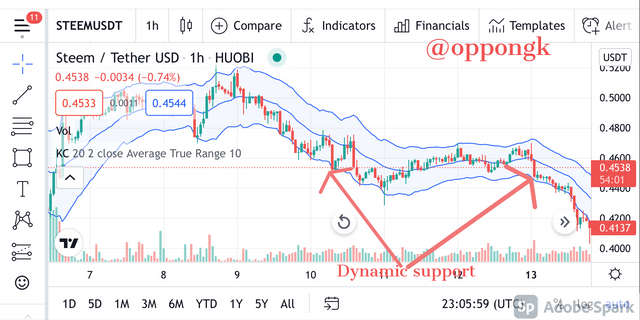
Screenshot from Tradingview

6. What's your understanding of price breakouts in the Crypto ecosystem? Discuss breakouts with Keltner Channels towards different directions. (Screenshots required).
What's your understanding of price breakouts in the crypto ecosystem?
When the price of assets makes sideways movement for some period of time, a breakout finally occurs and a support or resistance level is broken. The volatility of an asset contributes to the ability of an asset to break the dynamic support and dynamic resistance level and for this reason the Keltner channel indicator is able to confirm these breakouts. When there is a breakout, the price will be seen moving above or below the lines of the Keltner channel indicator. When the price breaks and takes any direction, the Keltner channel also follows the same direction.
Bullish Breakout
When a breakout happens at the resistance level during an upward movement, it is an indication of a bullish trend. When the price moves above the upper band of the Keltner channel indicator, which is the dynamic resistance area, we can say that the indicator has confirmed a bullish breakout. This confirmation shows that the price is making an upward movement and it alerts traders to make the right decisions in the market. The screenshot below is used to illustrate the discussion above;
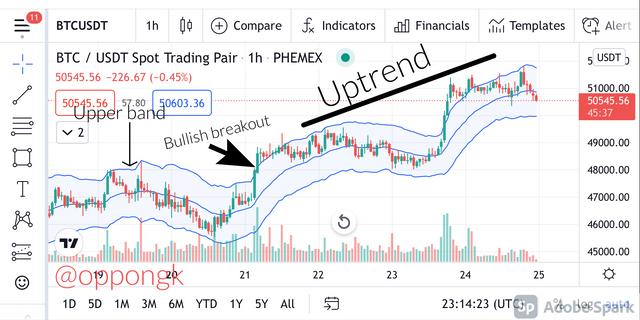
Screenshot from Tradingview
Looking at the chart above, the upper band of the Keltner channel was broken by the price and the upper band then turned to a dynamic support to the price. Immediately this happened, it was giving a sign of an upward movement and eventually the price made a bullish trend to confirm the breakout as we can see in the chart above.
Bearish Breakout
When a breakout happens at the support level during a downward movement, it is an indication of a bearish trend. When the price moves below the lower band of the Keltner channel indicator, which is the dynamic support area, we can say that the indicator has confirmed a bearish breakout. This confirmation shows that the price is making a downward movement and it alerts traders to make the right decisions in the market. The screenshot below is used to illustrate the discussion above;
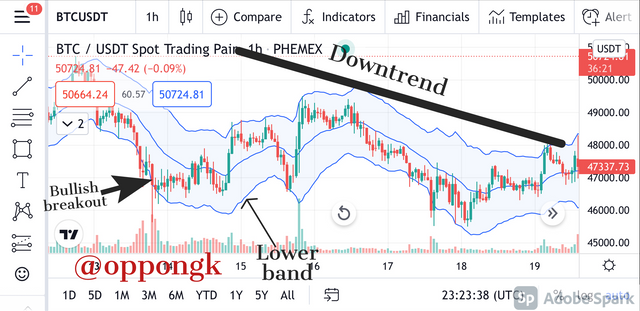
Screenshot from Tradingview
Looking at the chart above, the lower band of the Keltner channel was broken by the price and the lower band then turned to a dynamic resistance to the price. Immediately this happened, it was giving a sign of a downward movement and eventually the price made a bearish trend to confirm the breakout as we can see in the chart above.

7. What are the rules for trading breakouts with Keltner Channels? And show valid charts that work in line with the rules. (Screenshot required).
In everything there are rules that guide how to make it successful. Trading breakouts with the Keltner channel indicator is not an exception. There are actually some rules that we have to follow to get the best results when using this strategy. For both the bullish and bearish scenarios we have rules we have to follow for both. lets take a look at the rules below;
Bullish
The rules below must be followed to get good results for the bullish scenario;
During a price range or a price reversal, the price break and the point of price closure which takes place above the upper band must be noticed. This upper band serves as our resistance and it is very relevant to take notice of this.
At this point, we are advised to be patient and hope for another fall in price which will see the price trend on top of the middle line with the middle serving as the new support level.
Before we enter the market, we must confirm that the price is between the upper band and the middle line of the Keltner channel. At this point we also ensure that the price trend rests on the middle line with the middle line serving as the support. Traders at this point can enter the market after they have realized some few candles that are bullish.
After we enter the market, we have to set a stop loss immediately below the support level and set our take profit at 1:1 or 1:2.
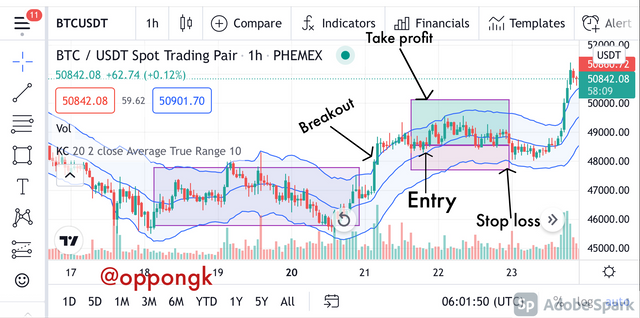
Screenshot from Tradingview
Bearish
During a price reversal, the point of price break and the point of price closure which takes place below the lower band must be noticed. This lower band serves as our support and it is very relevant to take notice of this.
We must also notice that the price has made an upward movement again then lean on the middle line which serves as the new resistance
Before we enter the market, we must confirm that the price is between the middle line and the lower of the Keltner channel. At this point we also ensure that the price trend leans on the middle line with the lower band serving as the dynamic support. Traders at this point can enter the market after they have realized some few candles that are bearish.
After entering the market, we can then set our stop loss on the middle line. Then we place a take profit at 1:1 or 1:2.
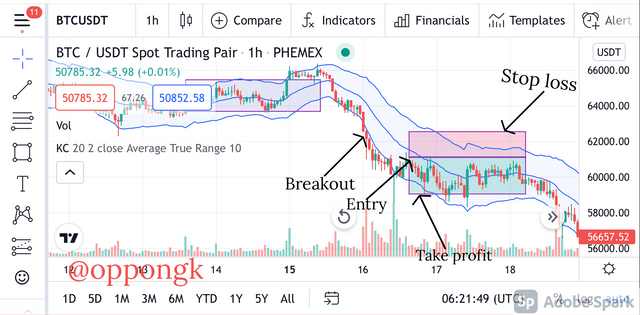
Screenshot from Tradingview

8. Compare and Contrast Keltner Channels with Bollinger Bands. State distinctive differences.
When we look at the physical structures of the Keltner channels and the Bollinger bands, they appear to be the same. Both indicators have the middle line and also have an upper band above the middle line and a lower band below the middle line as well. Despite these similarities, we can spot some differences between these two indicators when we go deep into their various features and their detailed structures. The two charts below illustrate the Keltner channel and the Bollinger bands respectively.
Screenshot from Tradingview: Chart with Keltner channels
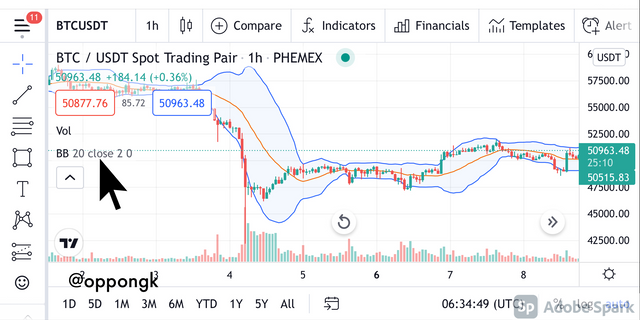
Screenshot from Tradingview: Chart with Bollinger Bands
Difference between Keltner channel and Bollinger Bands
- Band Difference
Keltner Channel
The average true range is used to generate the upper band and the lower band of the Keltner channel. This ATR represents the actual range of the price . The ATR looks at the movement of the price and then creates the bands to match them.
Bollinger Bands
In these Bollinger bands, the standard deviation of the prices are used to derive the upper bands and the lower bands. The formation of the bands depends on the sizes of the candles that can be found within the bands. Wider bands are created when the candles are large whilst small bands are created when the candles are smaller.
Difference in Representation of Signals
Keltner Channel
Like we said earlier, the Keltner channel uses the ATR to derive the bands and this is able to generate signals very quickly. This is why the Keltner channel is very appropriate for short term trading. And as a result of this too the Keltner channel generates false in so many situations.
Bollinger Bands
The Bollinger bands react relatively slowly to price changes because it uses the standard deviation of the prices to generate the bands. Because of this reason the Bollinger Band is not suitable for short term trades as it generates late signals which will not help in short term trades.

9. Place at least 4 trades (2 for sell position and 2 for buy position) using breakouts with Keltner Channels with proper trade management. Note: Use a Demo account for the purpose and it must be recent trade. (Screenshots required).
First Sell Trade
Screenshot from Tradingview
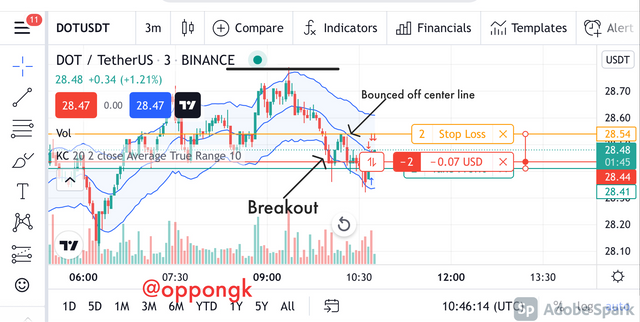
I decided to use the 3 min timeframe for this order. I intended to place an order for a DOT/USDT pair. This is because I realized that this was ranging and eventually a breakout happened at the lower band. The price then eventually moved to the center line and bounced off it. It was at this point I decided to place my sell entry after some few candles appeared.
- Take Profit = 28.41
- Stop loss = 28.54
First Buy Trade
Screenshot from Tradingview
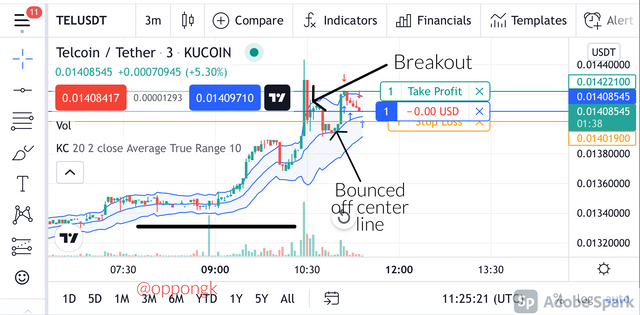
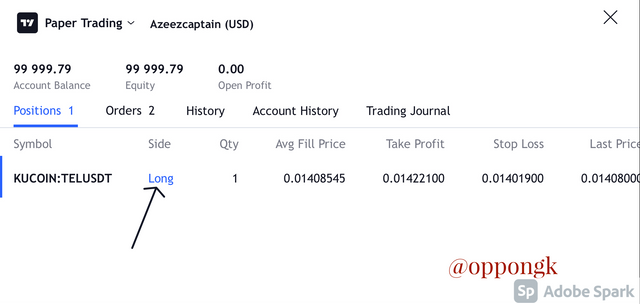
Similarly in this case too I used the 3 Min timeframe. This time I chose the TEL/ USDT pair. This is because I have realized that the price was ranging and eventually a breakout happened at the upper band. The price then eventually moved to the center line and bounced off it. It was at this point I decided to place my buy entry after a few candles appeared.
- Take profit = 0.01422100
- Stop Loss = 0.01401900
Second Sell Trade
Screenshot from Tradingview
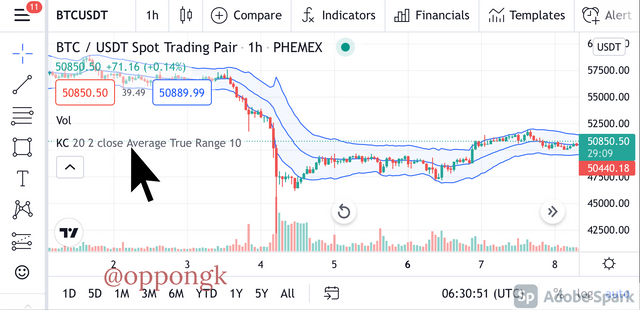
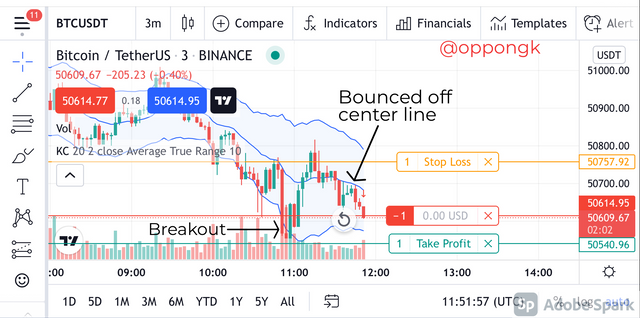
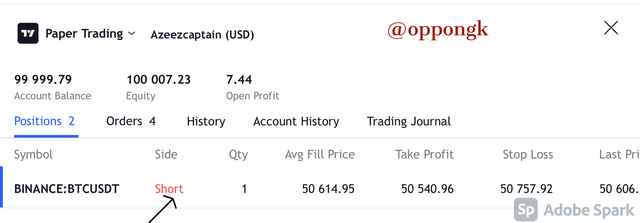
I decided to use the 3 min timeframe for this order. I intended to place an order for the BTC/USDT pair. This is because I realized that this was ranging and eventually a breakout happened at the lower band. The price then eventually moved to the center line and bounced off it. It was at this point I decided to place my sell entry after some few candles appeared.
- Take Profit = 50540.96
- Stop Loss = 50758.92
Second Buy Trade
Screenshot from Tradingview
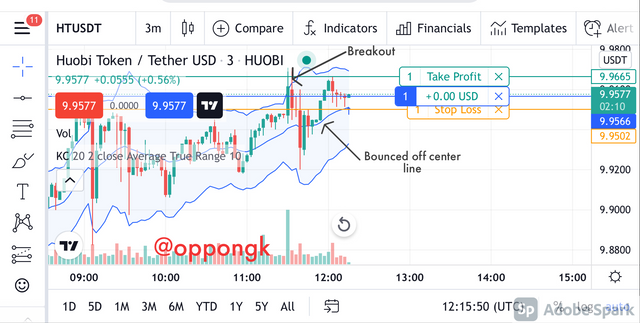
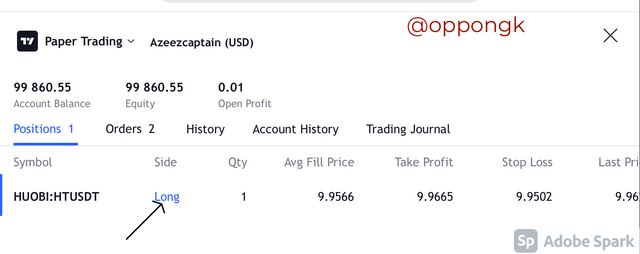
In this case too I used the 3 Min timeframe. This time I chose the HT/USDT pair. This is because I have realized that the price was ranging and eventually a breakout happened at the upper band. The price then eventually moved to the center line and bounced off it. It was at this point I decided to place my buy entry after a few candles appeared.
- Take Profit = 9.9665
- Stop Loss = 9.9502
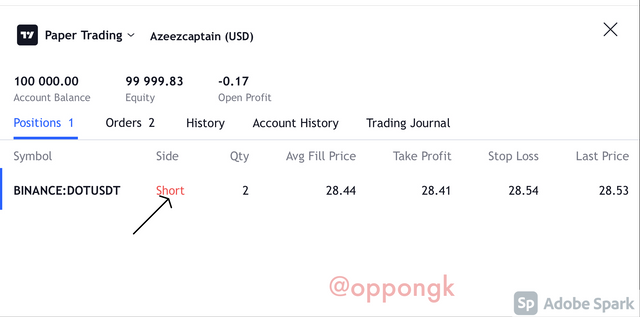
Trade Outcomes
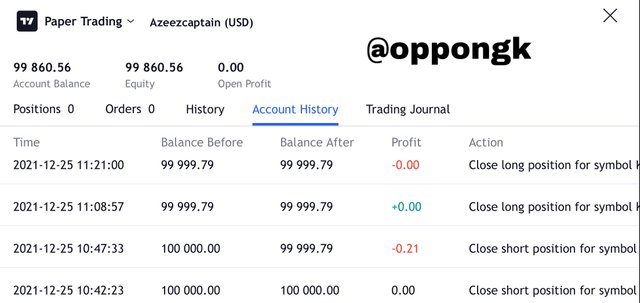
Screenshot from Tradingview

10. What are the advantages and disadvantages of Keltner Channels?
Advantages of Keltner Channels
- The Keltner indicator uses it's angle of movement to be able to determine the trend direction
- The Keltner indicator is very straight forward and simple to use hence even beginners can use it.
- The indication of price breakouts is very easy when using the Keltner indicator. This is possible because of the dynamic support and resistance of the indicator
Disadvantages of the Keltner Channel Indicator
- When there is a sudden change in the market, this indicator gives late signals. This is because the indicator relies on only the volatility of the asset
- The Keltner indicator also gives late signals because is also a lagging indicator. And as we know all lagging indicators give false at some point in time.

Conclusion
Like we discussed already, Keltner channel Indicator measures the volatility of a market and it relies on the ATR to do that. This indicator can be used to spot the dynamic support and resistance in a market by generating signals that will aid us in doing this. Breakout identification is also possible through the use of the Keltner channel indicator. The indicator is made of three lines which are the upper band, the lower band and the middle line (EMA). This lines are use to get some necessary information when using the Keltner channel indicator.
Thank you once again professor @fredquantum for the detailed lecture.
hello, i am new user why don't we help each other in this society by following each other :)
Yeah! It's very important. I am following you now. You can also join @steemfarm-market so that I can see you and curate your work. Thanks so much.
I have also seen that you have not began writing Achievement Task. I advice you begin as soon as possible for you to know how Steem works.
Great job friend 😊 nice idea