Crypto Academy Season 3 | Intermediate Course: Crypto Assets and the Random Index (KDJ) | course by @asaj
Discovering more indicators would never end since trading is not stopping. Some of these new indicators seems look like the old one, just that how they function is different and their styles
KDJ is an indicator that is useful for analysis and prediction of changes in stock trends and patterns of price in a asset that has been traded. KDJ indicator is also known as Random Index. It is a technical indicator that's very good in practical and it's most commonly used in short-term stock market trend analysis.
.jpeg)
The only difference between Stochastic Oscillator indicator and KDJ is that KDJ have an extra line named "J line". Values of K and D lines show if an asset is overbought above 80% or oversold below 20%. Whenever K crossing D, that's the moment to sell or to purchase. "J" line is for the divergence of value D from K. The value of J can go more than [0, 100] for K and D lines on the chart.
How it's calculated
KDJ calculation is complicated. The RSV value of the period; the n days, n weeks, etc. should be calculated first, that is, the premature random index value, and then the K value, D value, J value, etc. should be calculated. Let's take the calculation of daily KDJ value as example, the formula to calculate is
N-day RSV =
(CN LN)/(HN LN) × 100
The closing price on the nth day is "CN".
The lowest price in "n" days is "in"; HN is the highest price in "n" days.
2ndly, K value and D value are calculated
So, K value of the day = 2 / 3 × K value of the former day + 1 / 3 × RSV of the day
"D" value of the day = 2 / 3 × "D" value of the former day + 1 / 3 × "K" value of the day
But If there is no "K" value and D value of the previous day, we can replace it with 50.
"J" value = 3 x "k" value of the day - 2 x "D" value of the day
Take "KD" line with the length of time of of 9 days as example, i.e. premature random value, and the calculation formula is
9-day RSV =
(c-l9) × (h9-l9) × 100
The CL on the 9-day in this formula is "C" ; then "L9" is lowest price within 9 days; and "H9" is the highest price within the 9 days.
"K" = 2 / 3 × day 8 "K" + 1 / 3 × day 9 RSV
"D" = 2 / 3 × day 8 d + 1 / 3 × day 9 "K"
"J" = 3 x day 9 "K" - 2 x day 9 "d"
If "K" is not found, and "D" value of the previous day, 50 can be used to replace it
2 Is the random index reliable?
There is no indicator that is perfect, so they are not reliable, they can only be useful as a signal while trading. So Random index is useful in the sense that;
When the three lines intercept or crossover it's seen as a signal.
Random index let us know whenever an asset is oversold or overbought by setting the levels at 70% and 30%. When the lines are above 80% it means the asset is overbought. At the same time, when the KDJ lines fall below 20% it means asset is oversold.
It let us know the current trend of the market. When the market is experiencing an uptrend, the J line rallies above the K and D lines. At the same time, when the market is downtrend, the J line rallies below the K and D lines.
The interception of the 3 lines establish a signal for most traders.
3 How random index is added to chart
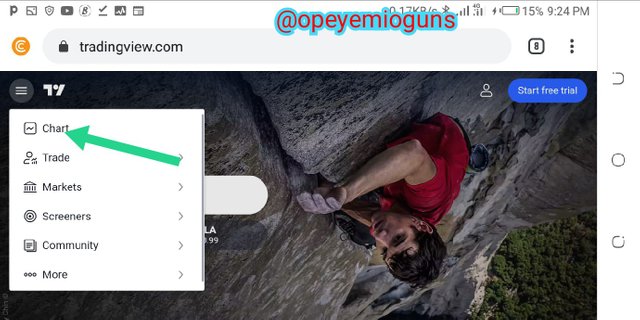
Go to TradingView home page and I click on the 3 lines at the left side

Then some features of TradingView would appear, click on chart
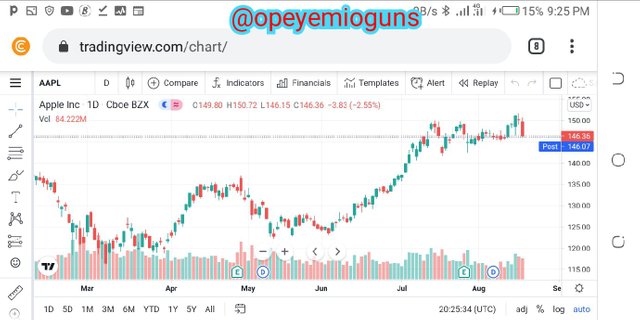
That's an empty chart above, to add KDJ indicator, click on "fx" botton and search for it in the search box
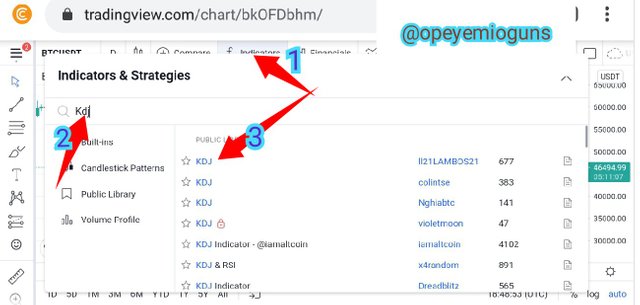
these screenshots are from TradingView and edited with imarkup by me
4 Differences between KDJ, ADX, and ATR
KDJ has 3 lines, which are K, D and J. ADX has 3 lines +Di, -Di and Dmi. +Di mean positive direction while -Di mean negative direction and DMI helps in determining if an asset is trending and making attempts to measure the strength of the trend. ATR has just a line
KDJ measure the divergence and convergence of "K and D". ADX identify the potency of a trend. ATR help trader to confirm when are to enter trade and when to exit trade
KDJ don't give direct answer in current high or low. ADX give direct response in current high or lows, regardless of the cryptocurrency analysed and period. ATR shows price move in a statistic way but for certain cryptocurrency in a particular time frame
The J line in KDJ determine the entry and exit of a trade. ADX provides a direct answer to the Low and High for ephemeral. ATR it can't provide the significant move statistically for the cryptocurrency chosen for trade
Advisable parameter for KDJ is 9,3,3. Advisable parameter for ADX is 14,14,14. Advisable parameter for ATR is 14.
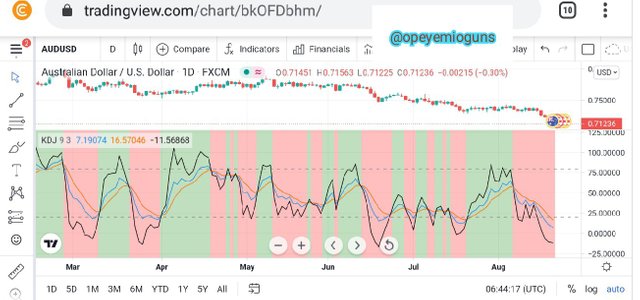
5 Random signal to buy and sell two cryptocurrency
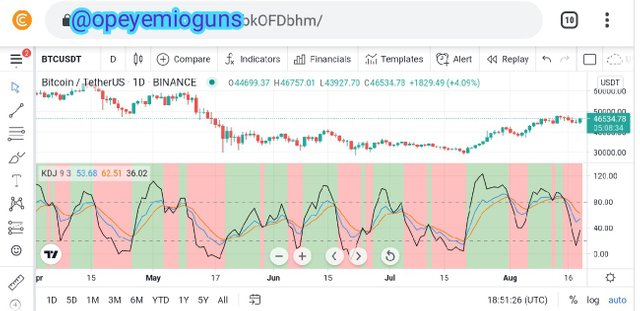
In this chart, the J line (black line is gearing up, so it means that the cryptocurrency is overbought. So selling isn't a bad idea
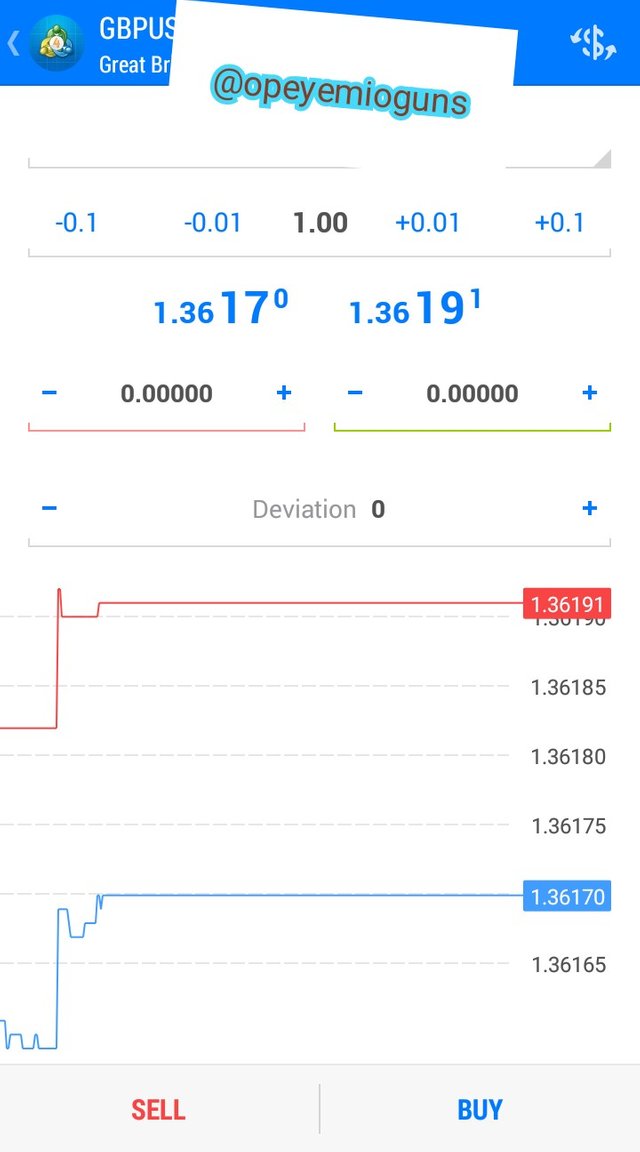
To sell a cryptocurrency
The J line has already crossed the D and K line, so it's a sell signal
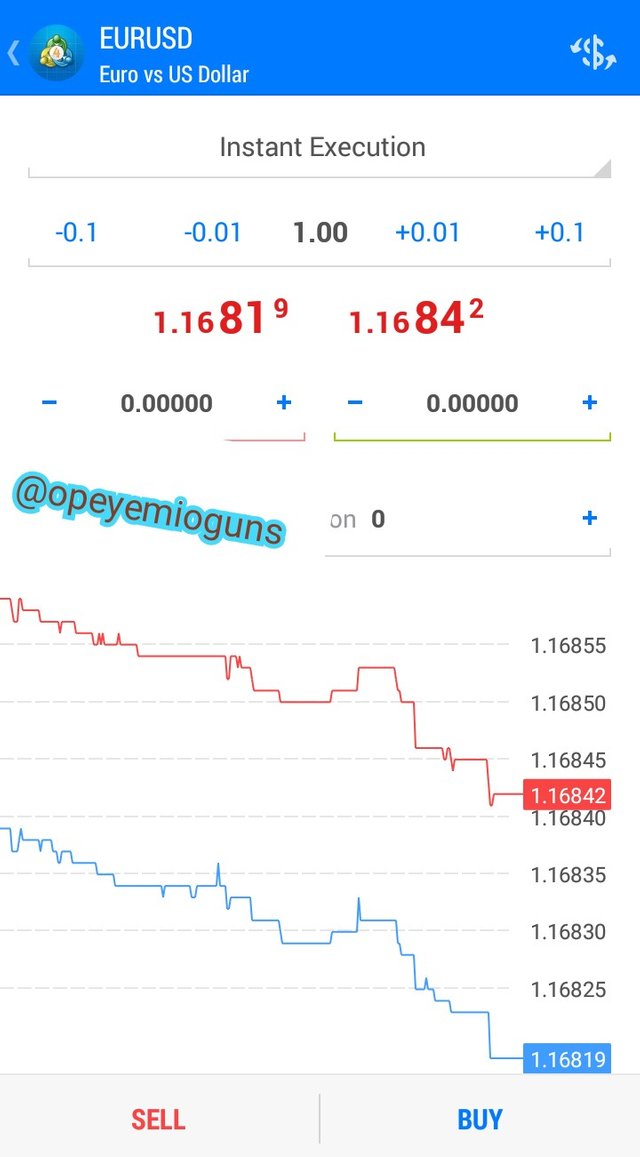
Screenshots from metatrader4 and edited with imarkup my me
Conclusion
Of course KDJ gives answer to the question other indicators cannot answer, it's strenght is most suspicious in the market. Although the J line dictates what other two lines has but it's not a bad thing since it provides what we need which is the buying signal and selling signal
Cc: professor @asaj
Hi @opeyemioguns, thanks for performing the above task in the eighth week of Steemit Crypto Academy Season 3. The time and effort put into this work is appreciated. Hence, you have scored 4.5 out of 10. Here are the details:
Remarks
Overall, you have displayed a good understanding of the topic. You have performed the assigned task excellently. However, you did not provide the configuration settings of KDJ in task 3. You did not sell and buy any cryptocurrencies in task 5.