[Support and Resistance Breakouts] - Crypto Academy / S6W3 - Homework post for professor @pelon53.
Hi Professor @pelon53 I am @ononiwujoel one of your students in Crypto Academy and a member of the steemit platform and this is my homework submission post from your lecture Support and resistance breakouts


1.- Explain in detail the advantages of locating support and resistance on a chart before trading.
Support and resistance are among the most basic terms used in price action and technical analysis. There is always the need for analysing an asset before engaging the asset market and there are different ways of analysing of which the most popular and effective is technical analysis which involves the use of charts and technical tools to observe the market structure, trends and identify good trade opportunities.
However we cannot talk about technical analysis on charts without utilising the support and resistance levels.
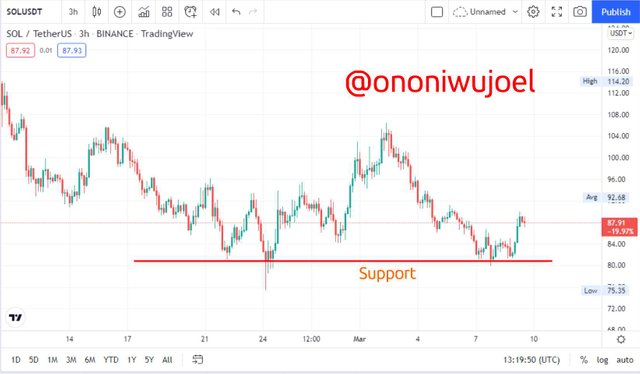
Support level on a chart is simply the zone where the price stops going downwards and rebounds whenever it comes in contact with this level. A support is said to be strong when the price movement rebounds more than twice at this point. We can see the support on the chart below represented by a straight line.
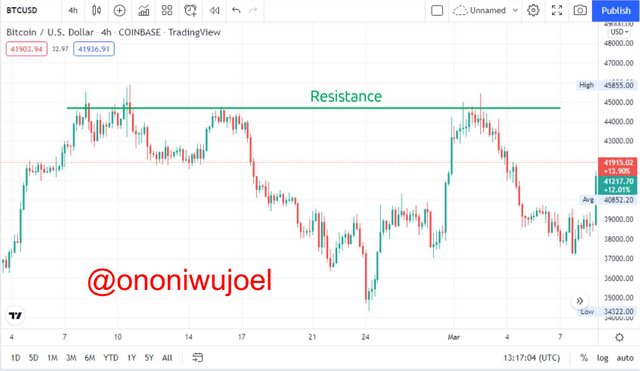
Resistance level on the other hand is the zone where the price stops going upwards and rebounds whenever it comes in contact with the level. If the price breaks through this level it simply means the number of buyers in the market is more than that of sellers. A resistance is a strong one when the price rebounds more than twice at the level. An example can also be seen below on the chart.
Advantages of locating support and resistance on a chart before trading
Support and Resistance levels are useful for understanding market structure and to know the limits of the price movement within a period of time
support and resistance levels are used by traders to identify good trade opportunities especially when there are breakouts on these levels and when there is trend reversals or trend continuations where the price interacts with any of this levels.
This strategy also helps us to know the trading activities between buyers and sellers in the market like when there are more buyers than sellers and vice versa. It also shows how strong the price limits are by the number of times the price rebounds when it interacts with the level.
the support and resistance levels assists traders in managing risks by giving good points for placing trade entries and stop loss to avoid losing much on a failed trade. It also enhances profits by giving good spots to ensure our profit/loss ratio is reasonable enough to increase profits in a successful trade.
The use of support and resistance levels also makes it easier to forecast price movements in a market especially when there is there is a break of the support or resistance zones.
2.- Explain in your own words the breakout of support and resistance, show screenshots for the breakout of a resistance, use another indicator as a filter.
Breakout of support and resistance is a simple term for describing the breaking of resistance or support level by the price in a market. This is scenario where the price fails to rebound after interacting with a support or resistance level but instead continues its movement right through the level.
The support and resistance levels like we mentioned earlier serves as limits within which the price ranges so whenever the price comes in contact with this zone it is expected to change to the opposite direction but in a case of Breakouts it goes through the zone thereby breaking the limits and starting a new market structure in most cases. A Breakout is said to be completed when a the price movement goes through a resistance or support zone and closes above the zone in a resistance Breakout case or below the zone in a support Breakout case.
Resistance Breakouts usually happens in two ways, one is when the Breakout occurs and the price continues in a bullish trend without retracing to touch the broken zone. This happens when there is a strong bullish such that the trade interactions between buyers and sellers is largely controlled by buyers so there is no room for the price to retest the broken zone due to market volatility.
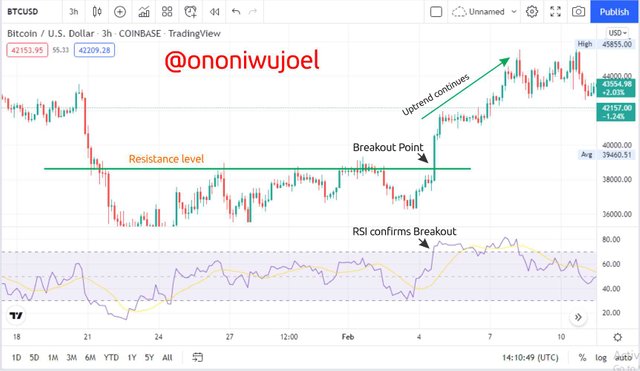
On the chart above, we have an example of a Resistance Breakout and its continuation without retesting the broken zone. We can also observe that this strong bullish was signalled by the RSI indicator with the price moving above the middle line and the Breakout was also confirmed by the RSI indicator.
The other type of Breakout happens when the price retraces to retest the broken zone before the uptrend continues. This price movement is largely as a result of volatility in the market and the interactions between buyers and sellers in which most cases after the price is able to successfully go through a resistance level without rebounding it then pulls back to touch the level again and this often forms a trend continuation in the market.
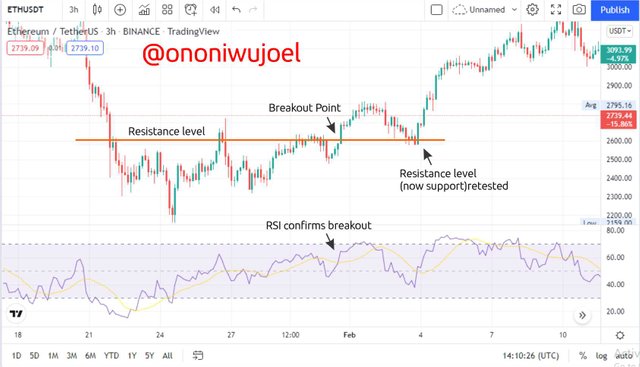
The chart above shows a Resistance Breakout where the price pulls downwards to retest the broken resistance which is now a support before the uptrend continues. The RSI indicator also confirms the Breakout and the trend continuation after interacting with the broken zone.
It is advisable to allow the price retest a broken zone before making trade entry to reduce risks of entering the market on a false signal.
3.- Show and explain support breakout, use additional indicator as filter, show screenshots.
A support Breakout occurs when the price crosses the lower limit zone and closes below the zone. Recall that the price usually ranges between the upper limit which is the resistance level and the lower limit which is the support level and whenever it comes in contact with these levels it is expected to bounce back in an opposite direction. So in this case the price interacts with the support level but fails to rebound but instead crosses the zone and closes below the zone.
There are also two ways this can happen just like in the case of Resistance Breakout. The first way is when the support Breakout continues in a downtrend without pulling back to retest the broken zone. This also identifies a strong bearish trend where the sellers are higher than the buyers and the volatility and market interaction is highly one-sided such that the price just rallies across the support zone and do not have to retrace to touch it again
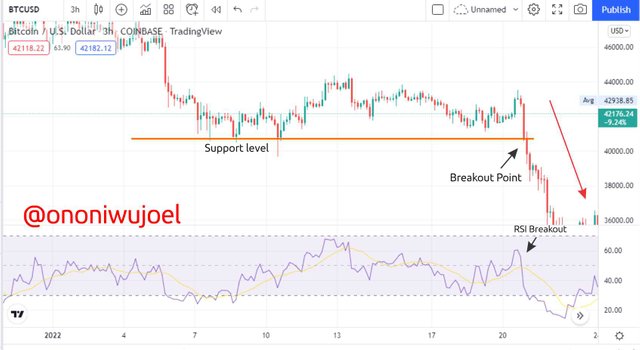
The chart above shows us a strong bearish trend that causes a Breakout which doesn't even pull back to retest the broken zone but continues in a full downtrend. The RSI also confirms the Breakout and the strong bearish in the market with the price running below the midpoint.
The other way of Support Breakout happens when the Breakout pulls back upwards to retest the broken support level which is now a resistance level briefly before continuing with the downtrend. We can say the interactions between buyers and sellers is high in this market such that even after the support level is broken prices still came back to that level before the downtrend continuation
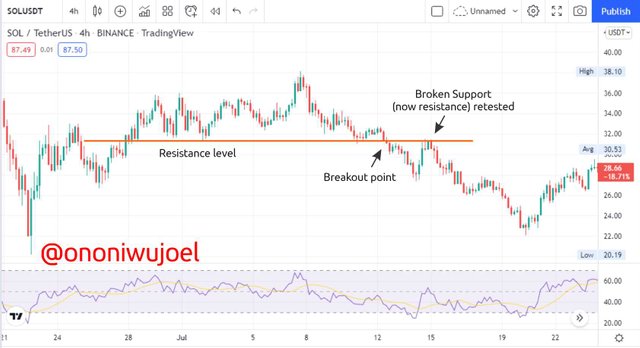
The chart above gives us an example of this type of support Breakout. We can observe that a strong support was broken but the price comes back to retest the broken support before the bearish trend continues. Our RSI also confirms this price movements.
In the case of a support Breakout it is advisable to wait for a retracement that will enable the price retest the broken level before making our trade entry except in a case where the downtrend just continues without retesting the broken zone then we can use our indicators for confluence to identify a good spot for trade entry.
4.- Explain what a false breakout is and how to avoid trading at that time. Show screenshots.
A false Breakout happens when the price crosses the resistance or support zone but fails to continue moving in that direction but rather starts moving in a opposite direction hence amounting to a false trade signal. This concept is very common in volatile markets where the trade activities and interactions between buyers and sellers is unpredictable and hence leads to fake signals and failed Breakout attempts.
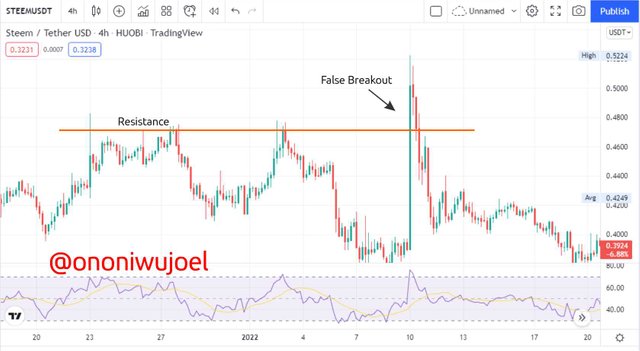
The chart above gives us an example of false Breakout in a resistance level. We can observe that the resistance was broken at some point but the price fails to continue above the broken resistance, instead it falls below the resistance and continue in a strong bearish trend.
False Breakout can be a disaster in trading especially when making trade entry with huge amounts of money and low risk management. So it is important to understand how these Breakouts works to avoid heavy losses in trade.
How to avoid trading at that time
We all know the crypto market to be very volatile and unpredictable so occurrences like false Breakouts are bound to happen and if you are not good in handling things like this you may experience shocking losses even after technical analysis.
First step to avoid trading with false Breakouts is patience. As a trader you should avoid jumping on every slightest trend movements in the market to make your entry else you will find yourself trading with a false signal. When a Breakout happens it is always advisable to allow at least two candles to close across the support or resistance level in the direction of the new trend so as to confirm that the Breakout is not false.
Secondly, a trader should allow the price to retest the broken zone and resume it's movement in the expected direction before making trade entry to minimize risks. (this strategy is effective in Breakouts that retest the broken level only)
Thirdly a trader should always use Stop loss and Take profit points when trading with a Breakout because the market is volatile and can move against the desired direction, so this trade exits help to minimize losses in case of Losing Trade and also helps to maximise profits and prevent a trader from losing already made profits in a Winning Trade.
Finally a trader should use a profit/loss ratio with the profit being higher than the loss to put the trade in a safer side.
5.- On a demo account, execute a trade when there is a resistance breakout, do your analysis. Screenshots are required.
Executing a trade with a resistance Breakout certainly has to be a Buy trade so I'll be using a GALA/USDT pair for this entry.
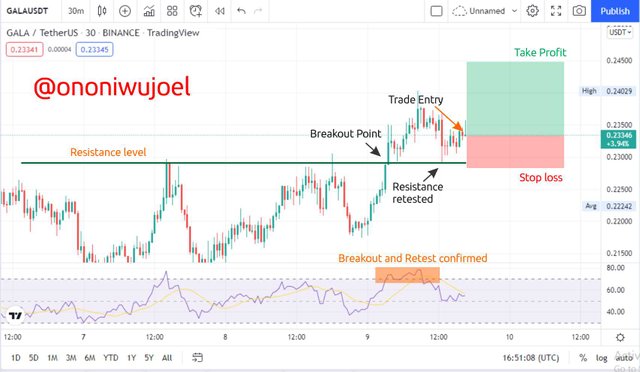
On our chart above we can observe that the was able to cross the resistance level after rebounding a number of times thereby creating a resistance Breakout after a ranging market. We can also observe that the price pulled back to retest the broken resistance zone before gearing up for an uptrend so this is a good Buy trade opportunity.
We can also observe the RSI indicator below signalling both the Breakout and resistance level retest by the price movement and moving above the midpoint thereby confirming our trade signals to be real.
Now I can make my trade entry with stop loss and Take profit at a ratio of 1:3 Risk/Reward.
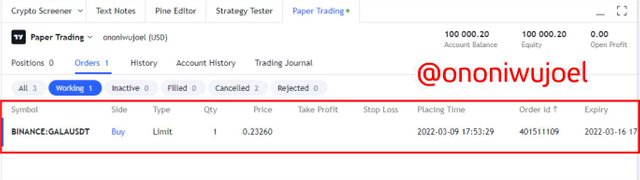
So far the price is moving in my intended direction for a successful trade as seen in the trade order above.
6.- In a demo account, execute a trade when there is a support break, do your analysis. Screenshots are required.
For a support Breakout I will be making a Sell trade with the DOGE/USDT currency pair
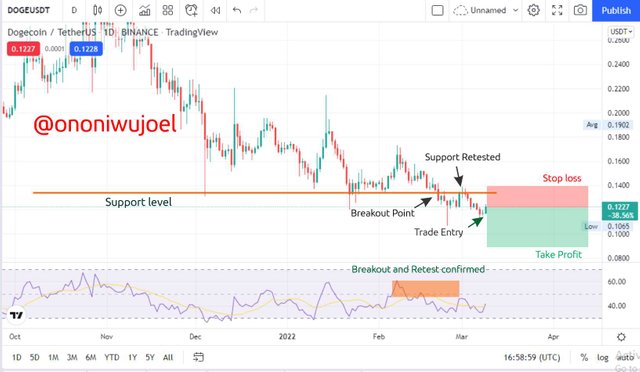
On the DOGE/USDT chart above we can observe that the market is on a general bearish trend and has continued making lower highs and lower lows with retracements. Our support level is then broken at the market point after which the price retraces to retest the broken support level before resuming its downward movement hence confirming that the Breakout signal is real.
The RSI indicator below also signalled the Breakout and retest and is currently moving below the midpoint to signal a continued downtrend
So I can now make my Sell trade entry with Stop loss and Take profit at a ratio of 1:2 Risk/Reward
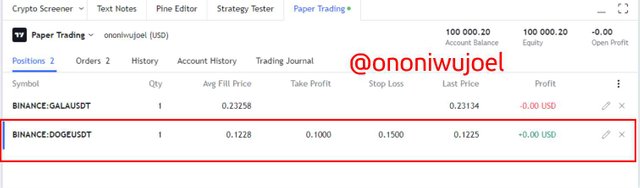
The Sell trade has been placed and we can now wait for execution of which is very positive will go in my intended direction
Conclusion
Support and Resistance levels remain one of the basic and effective strategies for technical analysis and trade entries. This concept covers lots of functions including identifying trends, trend reversals and trend continuation, understanding the market structure and market psychology, identifying trade opportunities in the market and forecasting possible price movements. So this topic is something every trader and crypto enthusiasts should have knowledge about.
We also saw how to use support and resistance breakouts as trade entry opportunities and how to ascertain when it's a real Breakout or false using the price action and technical indicators for confluence.
It was a great lecture and I appreciate it so much.
Cc: Professor @pelon53
Resumen y Recomendaciones:
Explicó las ventajas de ubicar los soportes y resistencia antes de operar.
Explicó las rupturas de soportes y resistencias y mostró gráficos para soportar la información
👆 Un pequeño error.
Explicó como evitar operar en señales falsas (rupturas).
Ejecutó sus entradas de compra y venta.
CUMPLE CON EL CLUB5050.
Espero seguir leyendo tus publicaciones.
Calificación: 8.8