Crypto Academy / Season 3 - week 8 / Homework Submission post for Professor @asaj / Crypto Assets and the Random Index Indicator / by @ononiwujoel
Hi Professor @asaj, I am @ononiwujoel one of your students in Crypto Academy and a member of the steemit platform and this is my homework submission post from your lecture Crypto Assets and the Random Index Indicator (KDJ)
Introduction
One of the most fascinating things about cryptocurrencies and other tokens is the crypto market which is well known for its high volatility and unpredictability. And so trading digital coins in the crypto space successfully requires a lot of caution, observation and professionalism to make huge profits.
And it's good we take note of the fact that a good can bring such huge amount of profits that will change the trader's life and in the same coin a bad trade can also make a trader completely bankrupt. So trading is a very important aspect of the crypto industry.
Due to it's volatility and constant price movement swings, many indicators have been made to help traders with technical analysis before making decisions on when and how to trade their assets to avoid loses and create better chances of making good profits from them which includes Moving Averages, Exponential Moving Averages, Stochastic Oscillator and many others but in this assignment we'll be focusing on a unique indicator called Random Index Indicator (KDJ)

- In your own words define the random index and explain how it is calculated
Random Index Indicator is a relatively new technical indicator that is very similar to Stochastic indicator but more advanced and precise than stochastic indicator.
Random Index Indicator is much simpler and more convenient than several indicators and can be used for observe trend patterns and price movements to identify preferable points for starting and stopping a trade position depending on what the trader actually wants.
In plain words, a KDJ indicator helps to clearly show the price movement in such a way that makes it very easy to see when there is uptrends, downtrends and swings of directions so that the trader can use the analyzed information to set up Orders and Limits as he sees fit for better chances of making profits.
Random Index Indicator is also known as KDJ indicator because it is made up of three different lines, the K-line which is usually blue, D-line which is usually red and J-line which is usually black.
As we can also observe, the J-line is actually the major difference between KDJ indicator and stochastic indicator because the other two lines are also found in stochastic indicator and functions similarly but the inclusion of the J-line makes Random index indicator more precise and helps traders to buy and sell assets at optimal points hence creates better chances of making good profits from trading.
The KDJ indicator has two straight horizontal lines that is usually marked 80 and 20 used for identifying when the asset is overbought or oversold. When the price pattern goes above 80 point then the asset is overbought and its a good time to sell but when the price pattern falls below 20 point then the asset is oversold and its a good time buy because prices will be cheaper at that point and will likely start an uptrend soonest.
Apart from the horizontal lines, the J-line is also used to identify more precisely when there is an uptrend and downtrend in the chart, when the J-line rises and cross other lines, that is a signal of an uptrend and when the J-line falls and crosses other lines then that is a signal of a downtrend.
In as much as the KDJ indicator is very useful for identifying good spots for trade entry and exit especially in markets with high volatility like the crypto markets, it is also advisable not to use KDJ indicator alone when doing technical analysis.
How Random index indicator is Calculated
KDJ indicator calculation is done with respect to the highest price, lowest price and closing price with respect to the period of time invloved, these are then used for calculating the values of the K-line, D-line and J-line respectively.
Another information used for calculating KDJ is the RSV which represents immature random index value with respect to the period of time. And it is important to first calculate the RSV before KDJ values as it is used for the calculation.
- To calculate the RSV we use
N-day RSV = (CN - LN) / (HN - LN) × 100
Where;
CN = Closing price in N days
HN = Highest price in N days
LN = lowest price in N days
- To calculate K value we use;
K value of the day = 2 / 3 × K value of the previous day + 1 / 3 × RSV of the day
- To calculate the D value we use;
D value of the day = 2 / 3 × D value of the previous day + 1 / 3 × K value of the day
- To calculate the J value we use;
J value = 3 * k value of the day - 2 * D value of the day
Note: If the K and D values of the previous day in the formula is not known, then the trader should use 50 as an average value for the calculation.
- Is the random index reliable? Explain
This particular question is a bit dynamic because there is no technical indicator that is completely reliable or 100% successful and that is the major reason we have several different indicators to fit into the different trading strategies used by traders.
But the level of reliability of an indicator can be shown in the number of traders using it with respect to when it was actually invented. If many traders using different trading styles prefer an indicator then that goes a long way to show that it is accurate and successful in technical analysis of charts.
So in this case, KDJ is still new compared to several other indicators so it is not yet popular among traders and it was developed as an improvement to the stochastic indicator which is mainly used to identify overbought and oversold assets and very helpful in volatile markets but also very weak and unreliable in stable markets, so the KDJ inherited these properties too except for the fact that it has the advantage of the J-line which makes it's signals more accurate and give optimal points for entry and exit of trade. But in my opinion I don't believe this is enough to make it very reliable indicator on its own since not every market is volatile and not every trader is good in risk management.
Having shown this, I believe KDJ can be reliable only when it is used with other slower indicators like the ADX, EMA and others, and with technical tools like Buy Stop orders, sell stop others, buy limits, sell limits etc. And it should only be used in markets with high volatility like the crypto markets because if its used in stable markets it will make false signals that can make a traders loose a fortune overnight.
- How is the random index added to a chart and what are the recommended parameters? (Screenshot required)
- To add Random index indicator to your asset chart maybe on tradingview, visit the site at https://tradingview.com and you'll be taken to the homepage

- Now I click on the chart option at the top of the homepage layout and my last chart displays.
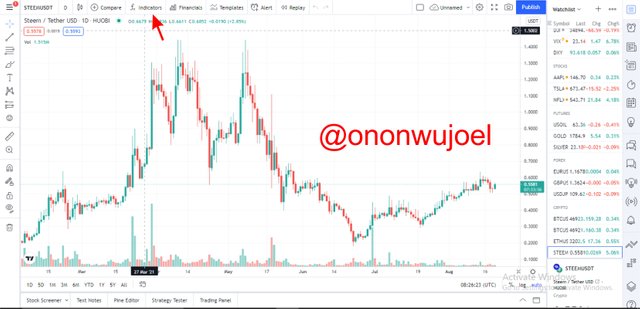
- Among the options at the top of the chart, there is the Fx indicators and I click on it
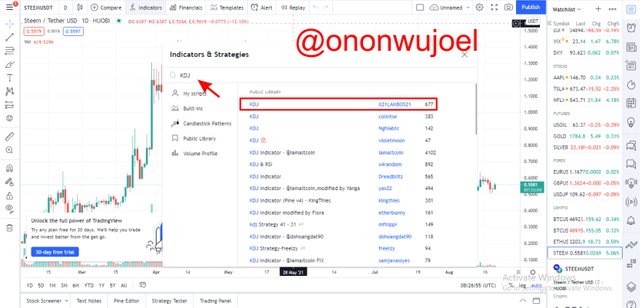
- Next page displayed is for indicators and strategies, so I type KDJ and the first option among the KDJ is the one recommended by Professor @asaj used by 1121LAMBOS21 with number 677 at the time I wrote this assignment. I click on it to use in my chart
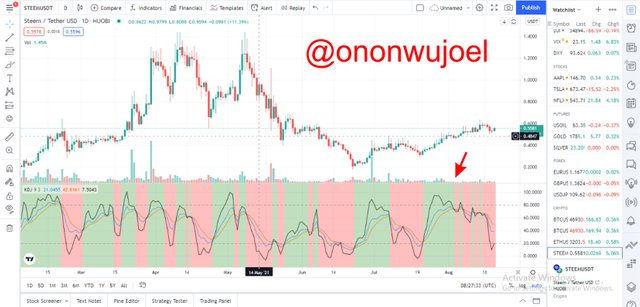
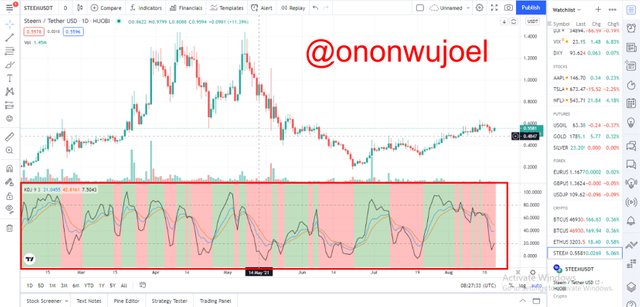
- And it is now added in my STEEM/USDT chart
Recommended Parameters
KDJ Indicator to be used is specifically the modified version of KDJ indicator used by 1121LAMBOS21 on tradingview. This user is very experienced and has good reputation score and his modified KDJ has the colors and features we need for easier understanding.
The KDJ indicator should only be used in markets with high volatility because that is where it's signals are more reliable but it should not be used in stable markets because it will send false calls which will make us incur losses
The horizontal lines identifying the points of assets being overbought and oversold should be 80 and 20 respectively because this will put us in a more accurate position to make profitable entries and exits
KDJ indicator is very useful for short-term trading but is not advisable for long term trading, instead EMA and MA should be used in the later.
KDJ indicators should be used with other indicators that will serve as confirmation because using KDJ alone is also risky due to fact that it send signals a little too early and they may turn out to be wrong signals, so its safer to use KDJ with other indicators.
Differences between KDJ, ADX, and ATR
KDJ, ADX and ATR are all very useful indicators for technical analysis but are different from each other in their own unique ways.
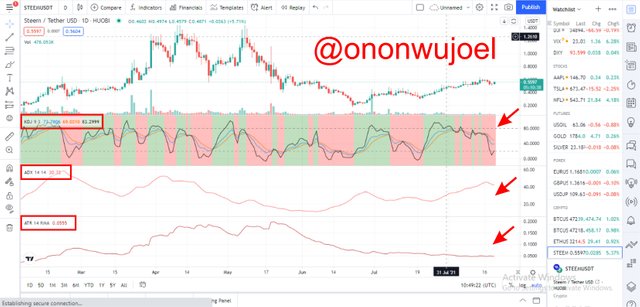
Random index INDICATOR also known as KDJ indicator which we have been discussing in this assignment is an improvement to the stochastic indicator with many similarities and is majorly used for it's strength in identifying when an asset is overbought or oversold and it also gives signals for trend reversals and forecasting of change of price movement of assets. And it makes use of the K-line, D-line and J-line coupled with the indicator colors to make the chart much easier to understand but it is not good for stable markets or long-term investments.
While the Average Directional Index (ADX) indicator mainly gives information on the strength of trends in the chart. It is also measured on a scale of 0 - 100 horizontally but it doesn't signal if the trend is an uptrend or downtrend, if the scale is below 20 then the trend is relatively weak but if its over 25 - 50 then it means the trend is strong and if it goes above 50 then a resistance has been broken but like stated earlier it doesn't show if its an uptrend or downtrend so you will not know when the asset is overbought or oversold.
On the other hand, the Average True Difference (ATR) indicator is mainly used to identify volatility in a chart, this indicator appears just like moving average but only gives information of volatility of a market.
Unlike the KDJ indicator, ATR doesn't give any price movement direction or areas of being overbought or oversold and unlike ADX it also does not give any hint on strength of trends. It only shows how volatile a market is, the higher the ATR the higher the volatility and the lower the ATR the lower the volatility.
It is commonly used by short-term and margin traders that makes profits from market volatility.
Use the signals of the random index to buy and sell any two cryptocurrencies. (Screenshot required)
I'll be trading BTC/USD and LTC/USD respectively in this question.
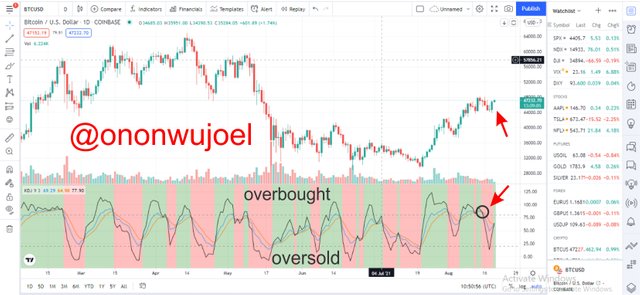
Observing the BTC/USD chart above we can see that the price movement is on a bullish trend where we have higher highs and higher lows, the points before brief downtrends are points where we can see Bitcoin has been overbought, so these points are good sell signals and this is where I'll put a Sell order with stop loss just above it with my take profit around the resistance line
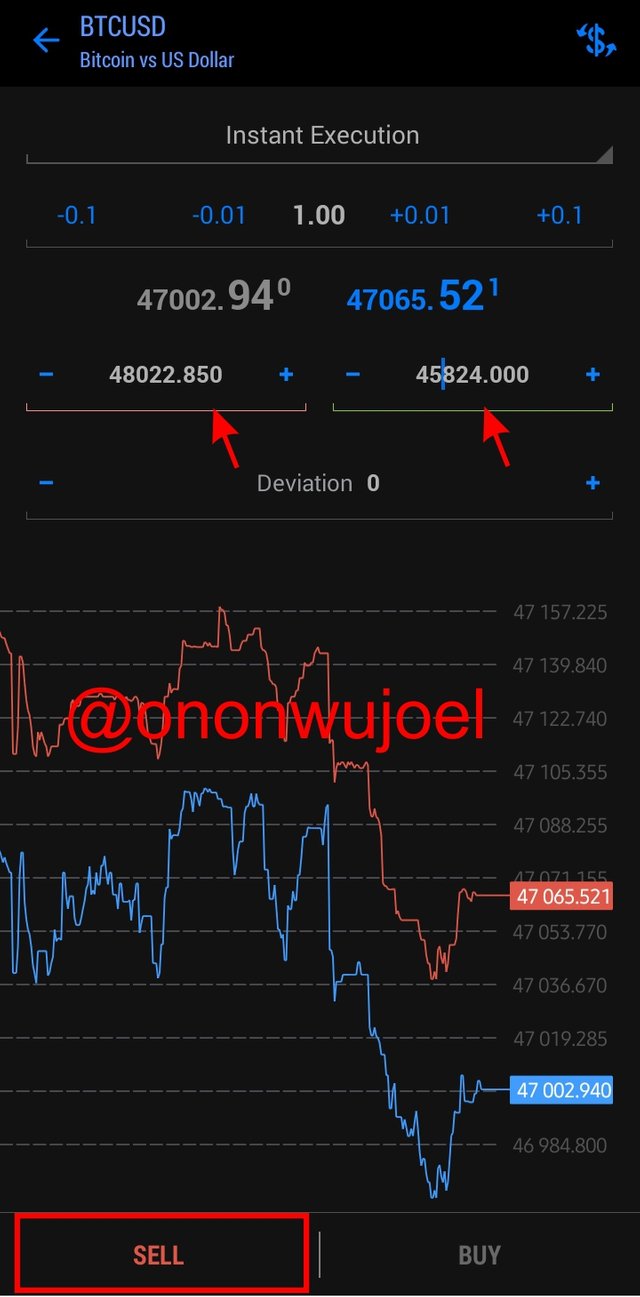
Now I'll move to the next trade before while waiting for this to execute.
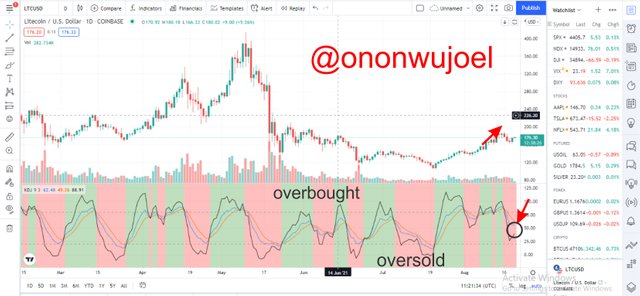
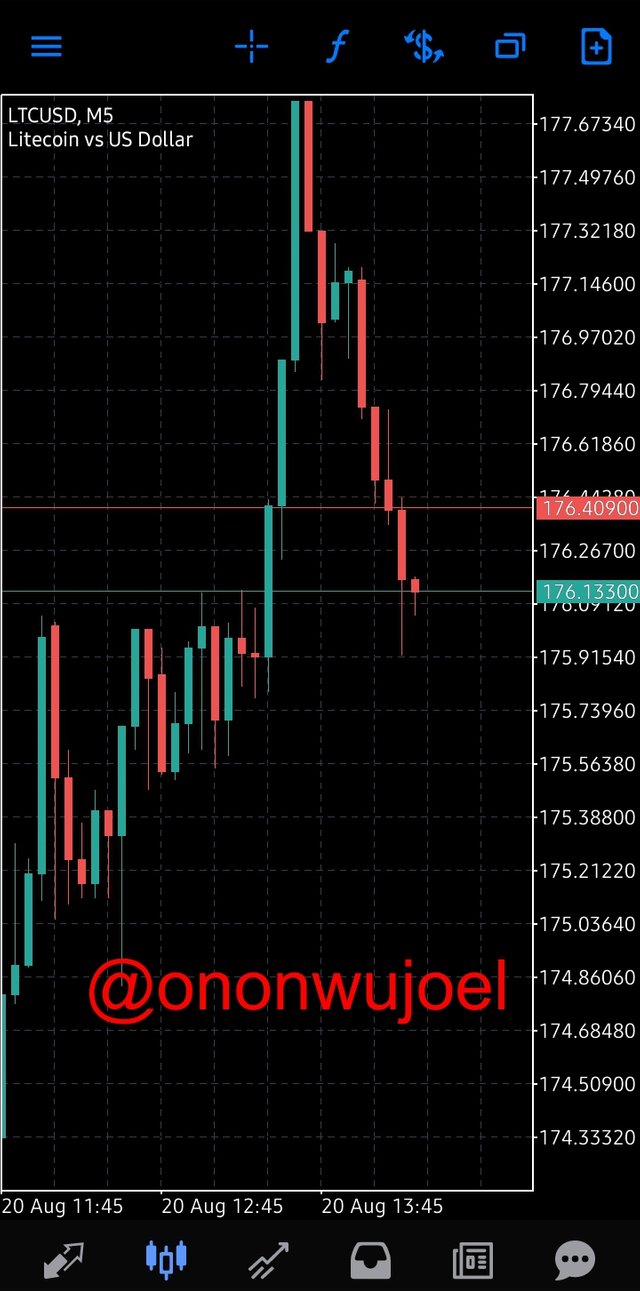
IN the LTC/USD chart above we can see the KDJ indicator has been added and it is quite difficult to conclude if the current uptrend will continue but the signal from the KDJ indicator shows there is a downtrend so I think its a good time to buy although prices have not fallen below the oversold zone.
So I place my buy order just below oversold line and stop loss below the current low.
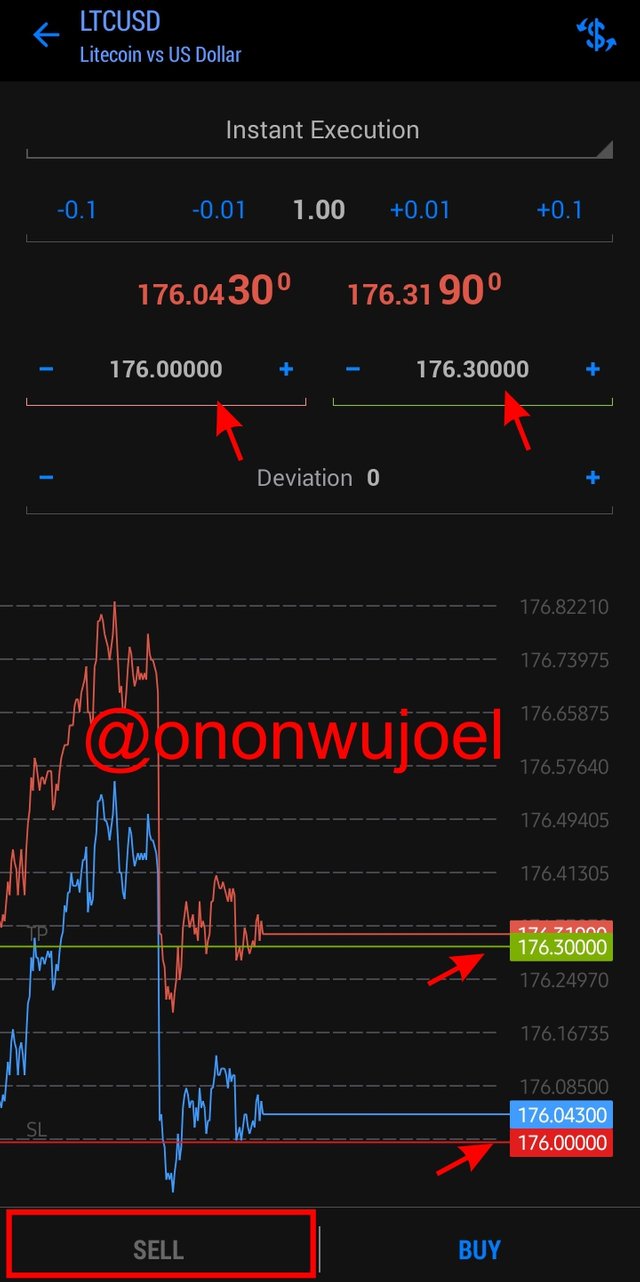
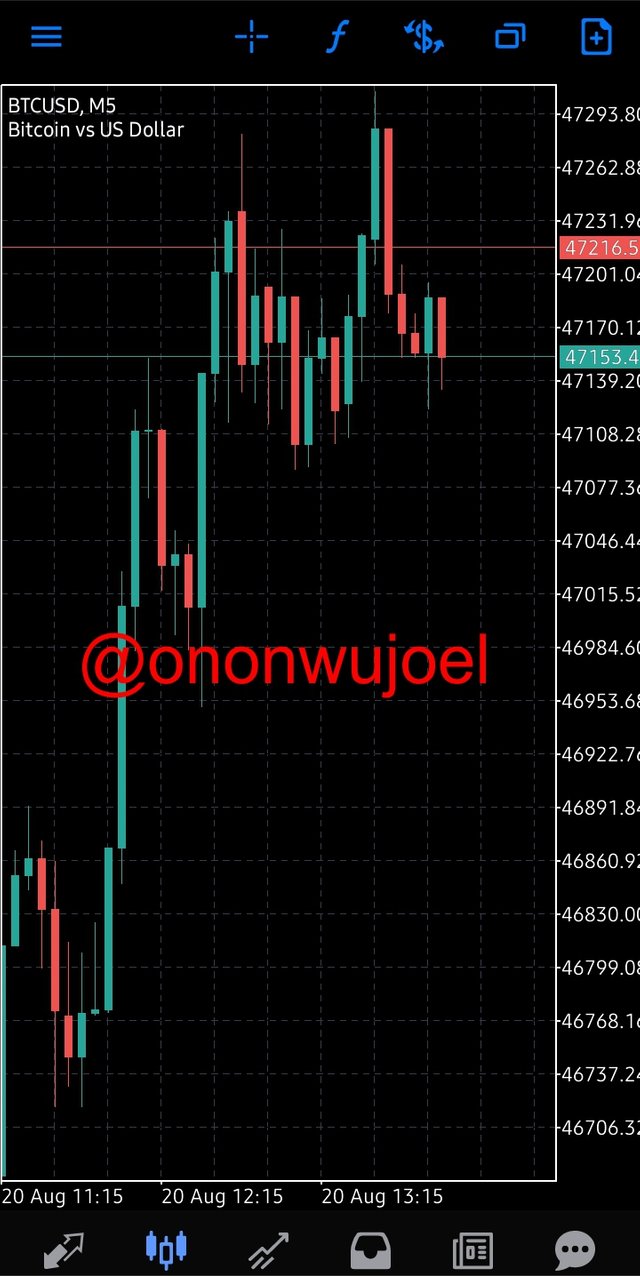
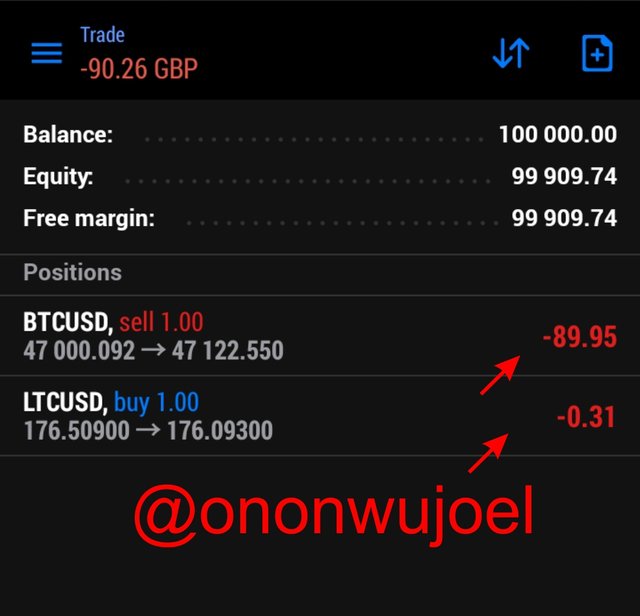
Having done that, I can now checkout my orders and so far they're doing just fine although they're yet to execute because the prices have not hit the exact points I set up
Conclusion
From the lecture and further research we have discussed so far we can see how important indicators are when it comes to technical analysis, they're one of the most important developments so far in the crypto market through which traders are able to make logical decisions on what, when and how to trade to make good profits and at with their convenient style of trading.
We have also been able to cover KDJ indicator and few other indicators and how they can be used in our charts for technical analysis, KDJ is actually a very good indicator when it comes to short-term and margin trading because it uses a combination of moving average, trend strength index and faster signals to give traders an advantage when trading although it is not good for stable markets.
It was a great lecture and I learnt a lot
Cc: Professor @asaj