Steemit cryptoacademy season 4//beginner's course//task10:-candlestick patterns.

image created by me on picsart

Task10-question1
- Explain the Japanese candlestick chart?
(Orginal screenshot required). - In your own words explain why the Japanese candlestick chart is the most used in the financial market.
- Describe a bullish and a bearish candle.Also,explain it anatomy.(Orginal screenshot required).
Explain the Japanese candlestick chart(Original screenshot required).

image created by me on picsart
Japanese candlestick chart has taken it place in the crypto world, as it is the most popular and easiest way a technical trader quickly analysis the price of assets. It shows the price chart that shows the opening,closing,higher and lower price point for each period.
Japanese candlestick chart is a graphical representation of the demand and supply on every price action of an assets within a particular period of time.
It provides details and accurate information about the price movement which technical traders use to analyze price movement (how price rise and fall). The candlesticks is relatively large, it is form showing the strong participation of traders and investors or between the buyers and sellers on a particular asset.
Looking at the brief history of Japanese candlestick, It was developed in 1700s by a successful rice trader Munehisa Homma in Japan. The system was developed to study the price rotation and how market react to it,that is to understand the supply and demand of the price of rice. After a successful development of Japanese candlestick chart it later became the most used chart by traders all over the world.
Below is the candlestick chart of bitcoin
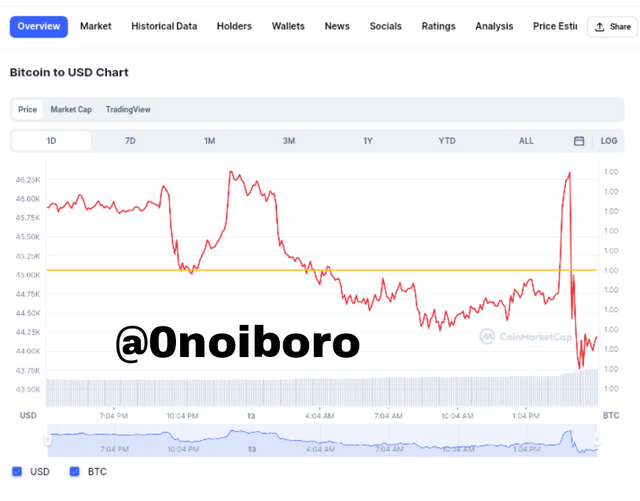
Image screenshot from coinmarketcap.com
in your own words explain why the Japanese candlestick chart is the most used in the financial market.
Below are different reasons why Japanese candlestick is often use in the financial markets.
Japanese candlestick is mostly use in financial market because it helps the stock traders to predict the future change in the price.
it mostly use in financial market because it has the ability to give a correct and accurate information about price market in a mere looking and understanding the graphical representation.
it is simple and easy to analyze through it appearance for traders that understands the chart,making trading easy to study the open,close,high and low point of a trade. with this,trader are always encouraged to use the Japanese candlestick chart.
Describe a bullish and a bearish candle. Also,explain it anatomy(original screenshot required).
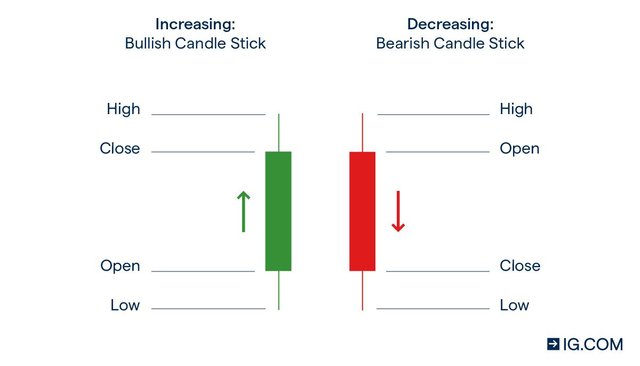

image created by me on picsart
Bullish is a green indicator that is used to identify reversals trend(uptrend) and indicate the higher demand of an asset. It informs traders that the market is about to enter an uptrend after a previous decrease in price.
When talking about the candlestick, the candlestick is always bullish if it place above an old candle. this process shows that there is an increase in price and also shows the next price movement in an uptrend.
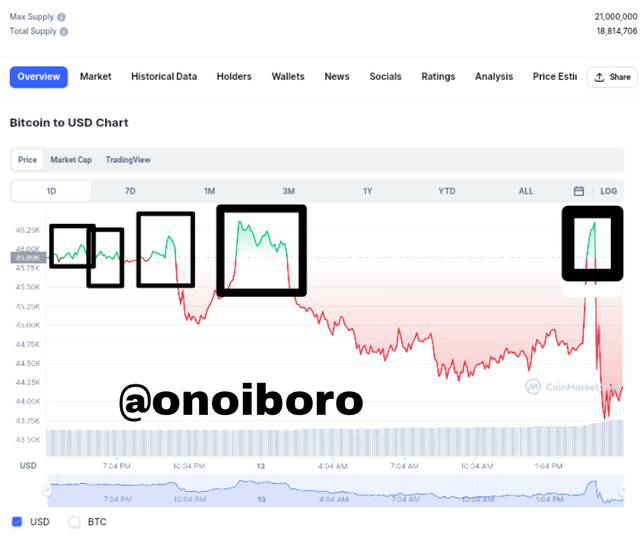
image was screenshot on coinmarketcap.com and edited on picsart
The anatomy of bullish candle
open:-open is also know as the opening price.It is a point that signifies the beginning of the price movement and also a point in which market is open and recorded. It is always indicated in an upward direction.
Close:-it is also know as closing price.
It a point that signifies the end of the candle within a timeframe and it also indicates the closing and last price recorded for a particular period.High:-this is a point in the candlestick that indicates the highest price recorded in a particular period of time.
Close:- This is a point in the candlestick that indicates the lowest price recorded in a particular period of time.

image was created by me on picsart
Bearish candle is a red color engulfed candlestick that forms in an uptrend identifying a reversal in opposite direction which is used to indicate the downward price movement.
It give traders signal that the market went low at a particular period of time and also shows the that,sellers has more control of the price than the buyers.
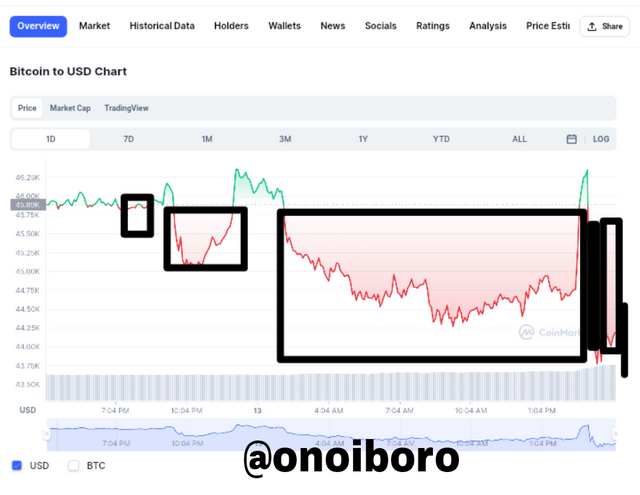
image screenshot on coinmarketcap.com and edited on picsart
The anatomy of bearish candle
Has explained before bearish as almost the same similarities with bullish in term of anatomy as both has open,close,high and low.
open(opening price):-it a point where candlestick begin within a particular period of time and also it marks the beginning of the price movement.
close(closing price):- it is the point that marks the end of a candlestick after a period of time.
high:- it is a point where the highest price was reach during a particular period of time.
The high can be above the open or the same as the open that for bearish.lower:- it a point where the lowers price was reach at a particular period of time.
In general, note that when the closing price is above the opening price bullish candles is form while when the closing price is below the opening price the bearish candle is form.
Once again thanks to prof. @reminiscence01 for the well explanatory and clarity on his lecture post.