Steemit Crypto Academy Season 3 Week 2 Assignment - Beginner's Course | Introduction to Charts
My sincere appreciation goes to professor @reminiscence01 for giving a detailed lecture on charts this week and after a good knowledge on the topic and making my own research, I will go straight to answer the questions given on the homework task for the week.

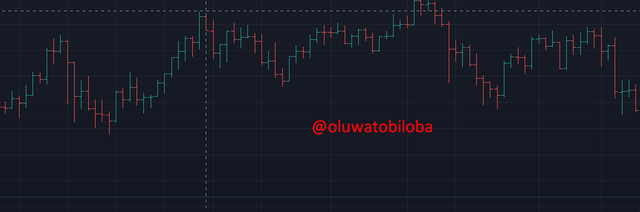
Explain the Japanese Candlestick Chart (Chart screenshot required).
Charts in the financial market are price movements recorded on graphs thereby creating a history that could be used to predict the next price action. Charts can be lines, images, graphical objects, and many more. Charts in a crypto context are mostly used by traders to identify the movement of activities within the crypto market, thereby enabling the use of technical analysis to determine the next line of action. Charts are usually represented by lines, graphs, and bars.
Japanese Candlestick Chart.
The name of this chart carries strong information on the features and origin of the chart and it is a strong representation of what the chart stands for. In the 1700s, Japanese rice traders used the Japanese candlestick even before it became a thing for financial traders around the world. It was discovered by Munehisa Homma who recorded weather, sales, and the psychology of customers and traders in the market which affects demand and supply within different periods of time. Munehisa Homma brought about the folk song "When it is sunny in Sakata, it is cloudy in Dojima.
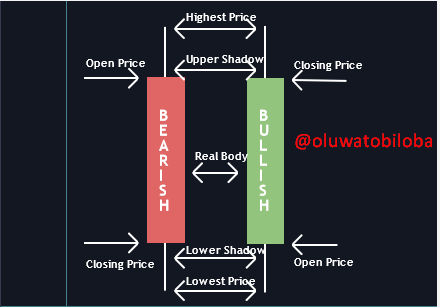
The Japanese Candlestick chart is a chart in which price movements are recorded in candles instead of bars. The candle has wicks/shadows on both ends or on either of the ends. The wide area in the vertical line of each candlestick is called the "Real Body". The Lower Wick/shadow represents the difference between the lowest price and the real body, the tip of the upper Wick represents the high of the candlestick. The body of the candlestick represents the difference between the open price and the close price of the candle. Candlesticks usually have two colors (white and Black) but on trading platforms, there is a default of Blue and Red, so I will be using the Blue and Red colors. If the real body is red, then it means that the session ended with a price lower than its opening price but when the opposite happens thereby having the real body as blue, then the session ended with a higher price than its opening price.
Keypoints
- The rectangular part of the candlestick line is known as the real body.
- Real body represents the difference between the open and close price.
- The upper and lower thin lines in the candlestick are known as wick/shadow.
- Candlesticks with no upper shadow are known as shaven heads while candlesticks without lower shadow are known as shaven buttom.
Anatomy of the Japanese Candlestick Chart.
- The green bar signifies an upward price movement, which is often referred to as a bullish period on the crypto chart.
- The red bar signifies a downward movement in price, which is often referred to as the bearish period on the crypto chart.
- The candlestick bar are presented in a form of a bar and they also have a wick, this wick point is used to represent highest or lowest points.
A Japanese candlestick is made up of: The body, shadow, high, close, open and low.
- High indicates the highest price of a particular coin at a given point in time.
- Open indicates the price at which the coin was introduced to the market.
- Close indicates the closing price of a coin at a given point in time.
- Low indicates the downward movement of a particular coin at a given time.
The Japanese Candlestick chart operates on three types of patterns and they are; Single pattern, double pattern, and then triple pattern.
The Single pattern is the easiest available pattern because it serves as a pattern that launches another pattern while conducting market analysis in the crypto space. The single pattern focuses on just one trading period and it entails spinning top, hammer, and shooting star.
The double pattern has its focus on two trading periods and it entails; Harami, Tweezers, and Homing pigeon.
The triple pattern operates on a three-way signal and as a result of this, it is considered the strongest of all available patterns and it entails: Morning star, three white soldiers, and the evening star.
Describe any other two types of charts (Screenshots required).
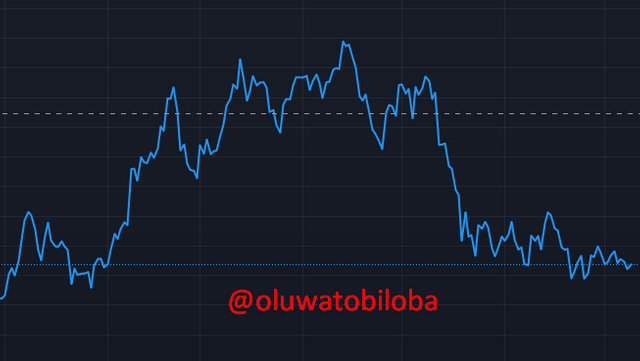
Line chart.
Line chart is the simplest and basic chart. It is a line plotting the closing price of the market at a given time and connecting them together. The line chart is usually displayed and represented with the use of a line just as the name implies, amongst the various types of charts available a line chart displays the least of all information. It simply connects close prices together, a line chart is displayed in a simple format of showing date and time and on the other hand displaying the price as well. It can be used to identify the trend of a market by analysing it. Trading patterns such as the ascending and inverted scallop is easy to identify with the line chart.
Bar charts.
This type of chart is a little more complex than the previous chart explained, this chart displays closing and opening price, although bar charts are not too complex but they display a stronger level of information compared to line charts. With a bar chart, it is easy to study the movement of prices. Bar charts are charts made up of vertical lines representing the highs to low range within a period of time.
In your own words, explain why the Japanese Candlestick Chart is mostly used by traders.
The Japanese CandleStick chart is mostly used by traders because of a few reasons including:
Ease of Understanding: The Japanese candlestick is very easy to understand even for first-time traders with little experience. It is very easy to harness the power of the chart.
Market history pattern is easy to view: it is easy to identify a possible market move with the check on the historical movement of the Japanese candlestick chart.
Increase the efficiency of analysis compared to Line and Bar charts, making analysis faster and more accurate.
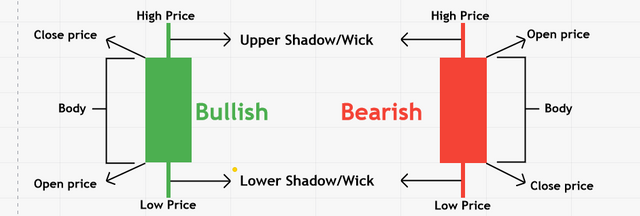
Describe a bullish candle and a bearish candle identifying its anatomy (screenshot is required).
Bullish candle.
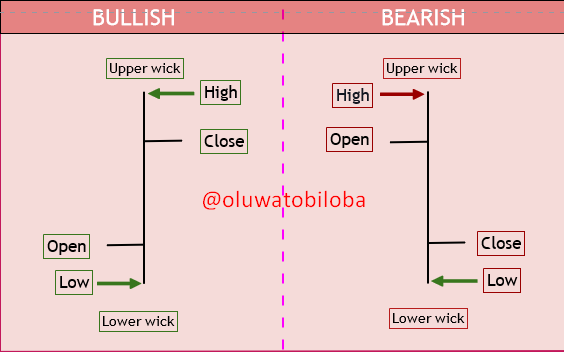
A bullish candle signifies an increase or upward movement in the price of an asset. It shows that there are more buyers than sellers and there is a greater demand which causes a rise in price. It becomes a bullish trend when there is a continual increase in the price of the asset involved and it is usually represented by a green color.
Anatomy of the bullish candle.
The open point will be found at the bottom of the candlestick.
The close point will be found at the top of the candlestick.
Bearish candle.
A bearish candle signifies a decline in the price of an asset, it becomes a bearish trend whenever there is a continual decline in the price of that asset, and the candlestick in this case is usually represented by a red color.
Anatomy of the bearish candle.
The open point will be found at the top of the candlestick.
The close point will be found at the bottom of the candlestick.
Conclusion.
The Japanese candlestick chart has proven to be a good instrument in the hands of traders and it has several positive advantages over other crypto charts. I am grateful to this week’s lecture for providing me with the opportunity to explore several trading charts and understand the great advantages associated with the use of the Japanese candlestick chart. Thanks to professor @reminiscence01 once again.
Hello @oluwatobiloba , I’m glad you participated in the 2nd week of the Beginner’s class at the Steemit Crypto Academy. Your grades in this task are as follows:
Recommendation / Feedback:
You did an excellent work here. Thank you for participating in this homework task.