Crypto Academy Season 2 Week 6 Homework Post for (@fendit) - Elliott Wave Theory
This week, I am really happy to be a part of the academy, learning from the fountain of knowledge that our professors have acquired over time. For today's assignment, I will be writing on @fendit's post after attending the class on Elliott wave theory. Join me as I continue on the journey to explain Elliot Wave theory and answer questions asked in the class.

What's the application of this theory?
Elliott wave theory is aimed at helping traders and investors forecast the future direction of prices of stocks, cryptocurrency, indexes, forex, and so on. The theory was propounded with the intention of proving that free trade trends are a result of market psychology rather than news. Elliot Wave proves that the market price is repetitive and follows a set of interlinking waves.
Elliott wave shows that all technical analysis is based on a circle of investors and traders' behavior, attitude, and emotions which then reflects on the price in the market. With Elliot wave theory, it is easy to forecast if an asset price would hold or break a support or resistance.

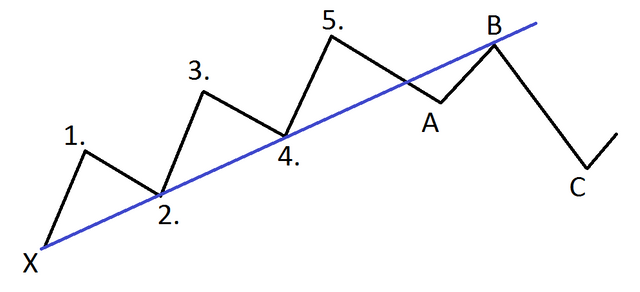
R.N Elliot noticed that the market was always moving but the movement was in a wave-form. The wave was an impulsive 5 step and a corrective 3 step for both bullish and bearish market.
What are impulse and corrective waves? How can you easily spot the different waves?
Impulse Waves
Impulse waves move the market in an upward direction. The moves are very powerful consisting of 5 waves and sub-waves of 5 and 3. Impulse waves are of numbers 1, 3, and 5 moving upward, with wave 3 being the longest of the three waves, and waves number 2, and 4 moving downwards.
Corrective waves
As the same implies, it is a correction or retracing move of the previous trend. The corrective wave has 3 waves a, b, and c which is a change in trend. In a bull market, the corrective waves are bearish while in a bear market, the corrective waves are bullish.
The corrective waves can be in different types, Zigzag, Flat, and Triangle.
How can you easily spot the different waves?
Wave 1 is the first impulse wave and it is accompanied by 5 sub-waves before getting to Wave 2
Wave 2 is a retracing from Wave 1 and the drop doesn't go to the starting point. Wave 1 to Wave 2 has 3 sub-waves.
Wave 3 is the longest of the impulse wave and should never be the shortest impulse wave, and should be able to extend. It has 5 smaller waves.
Wave 4 is a retracing wave from wave 3 and it shouldn't go below wave 2. It has 3 sub-waves in the main wave.
Wave 5 is the last impulse in the Elliott wave. it is the peak of the tops of bottoms in the wave and it is followed by the corrective waves. Wave 5 has 5 sub-waves between waves 4 and 5.
Wave a and c are corrective waves that would go down in a bullish market and up in a bearish market.
Wave b is a corrective wave but it goes up in a bullish market and down in a bearish market.
What are your thought on this theory? Why?
It is no doubt that Elliott Wave theory is one of the most acceptable technical analysis. This has gained a lot of traction following the fact that the market naturally follows its rhythm. With Elliott wave, it is easy to identify when a coin is being bought or overbought as well as a corrective phase in the trend.
It can be argued that the Elliott wave theory isn't valid since it isn't a rule and it does not have a valid base but then, I a lot of people are starting to study the theory making it something that people follow subconsciously as a result of emotions.
Choose a coin chart in which you were able to spot all impulse and correct waves and explain in detail what you see. Screenshots are required and make sure your name which cryptocurrency you're analyzing.
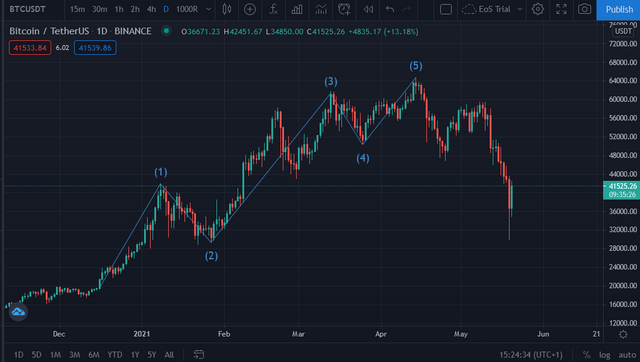
BTC/USDT
I will be using BTC?USDT on Tradingview
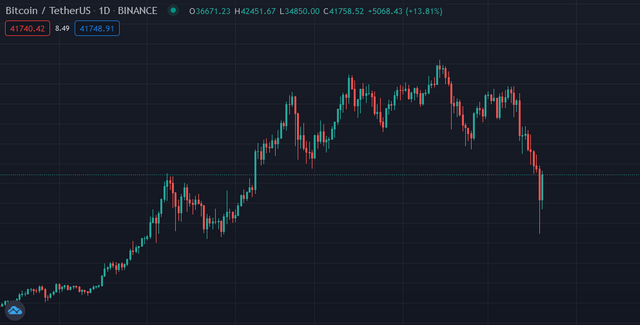
Since Bitcoin has a lot of volumes, it would be very easy to find an Elliott wave in the chart. The first thing to do is to determine the impulse wave. The first/base point starts from $19454.64, point 1 at $41862.88, point 2 at $29298.72, point 3 at $61292.00, point 4 at $50282.16, and point 5 at $64659.71.
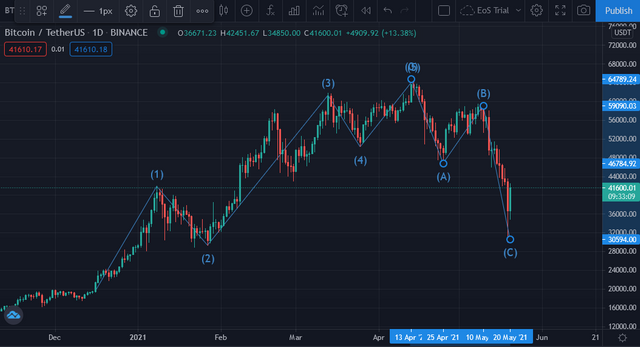
After drawing the impulse wave, the next step is to draw the corrective wave A, B, and C. The correction wave will be bearish since it is a Bullish market.
Conclusion
Personally, I will not recommend using Elliott wave theory alone to determine the next line of action while trading. It is good to use two or more technical analysis and indicators to give certainty on the price action and next step while trading.