Price Action + Break-Even Technique - Crypto Academy / S4W4 - Homework post for @ lenonmc21 by @olawole111.
Hello steemians trust our day going smoothly, I would like to welcome you to my week 4 task 4 assignment on the topic price action strategies lecture taken by professor @lenonmc21.

Theory
Define in your own words what Price Action is?
Price action is the study of the current price movement of the market on real time basis, it involves the swing highs and swing lows, support and resistance, demand and supply of a chart pattern. price action does not involve the use of technical indicators because technical indicators are calculated based on what has happened in the chart per time probably hourly, daily , weekly and monthly.
Technical indicators are not really advisable because the calculations are not in real time which might not be accurate or late, so when we take our entry based on that the technical indicators are saying it might lead to fake out because they are not operating in current time of the market, they operate based on what has been calculated, though technical indicators bring positive results sometimes but as a trader it's not the best strategy to base on.
Price action offers us the opportunity to analyse the market based on current real time by studying the behaviors of the chart pattern and know our balance point in which we will be emphasizing on soon, on this balance point we draw our horizontal line to note that particular zone.
price action is a type of technical analysis that ignores fundamental factor of the the market and its is done when the market is volatile because when the market is quiet , there's no movement in the market and what we do here basically is to study the price movement and since we have a quite market there's nothing to study.
Define and explain in detail what the "Balance Point" is with at least one example of it (Use only your own graphics?
Balance point is point of equilibrium in a market cycle, balance point is like a consolidation area on the market cycle where a reversal or continuity is expected, when we have a balance point the market is telling us that there will be a breakout (continuation or reversal).
We can also call balance point the breakeven as earlier explained above, this point is a very important point in price action analysis in which the last candle of a continuation or reversal is used, a horizontal line is drawn across the last candle to give and equilibrium point where our entry and exit point can be taken.
There are some things to watch out for why determining our balance point which are ;
Trends
Trends shows the direction of the market movement of a market cycle,it could be uptrend or downtrend.Breakout
Breakout is very important in price action because after the consolidation of the market price breakout is bound to happen.Candlesticks
The type of candlestick formed is also determine the direction of the market, the likes of the engulfing candlestick.
Clearly describe the step by step to run a Price Action analysis with "Break-even"?
There are some important steps in the analysis of our break even point which will be explained below
step one : The first thing to look at the is the time frame In which your want to analyse your Price action from, choosing of time is determined by the kind of trading system a trader is practicing , either swing, day and intra day trading depending on the traders choice, with any of this trading system we can choose our time frame for example for a swing trader we can analyse at the weekly chart then enter our trade in a day time or H4 time frame.
step two ; Assuming am a swing trader as earlier said I will go to the weekly chart to pick my balance point which is the (support and resistance) by drawing a horizontal line under the the balance point then we will go to a smaller time frame to pick our entry point.
step three
Since we've gotten our balance point, now we will look for a very good entry point with a good risk reward ratio to enter the market, risk reward ratio (RRR) is very important that all trader should know and always make use of to get maximum profit.
What are the entry and exit criteria using the breakeven price action technique?
- For an entry criteria
Haven chosen the balance point of the support and resistance, we have to mark out that point by drawing a horizontal line across the candle that mark this balance point, the next thing to do is to wait patiently for the market price to break the balance point either upward or downward then we put our stop loss below the balance point and our take profit above the breakout candle depending on the risk reward ratio the trader wants to used
- For an exit criteria
When the market has broken the break even point , then we keep an eye on it and watch out when the buy session for example expires because every trade placed has an expiring timr depending on the time frames we took the trade or another way to exit a market is when a reversal candle stick is forming like bullish or bearish engulfing candle ,then we should prepare to exit.
What type of analysis is more effective price action or the use of technical indicators?
Price actions are very more effective in trading than technical indicators because technical indicators are calculated using the previous market behavior either hourly,daily and weekly ,it is not calculated with real time .
Working on a real time market cycle gives a very precise behavior of the market, that is why price action is very good and its better than technical indicator and price action shows us the real trend of the market and we all know that in trading trend is very important because if as a trader we go against the trend we will loss out funds and there's a saying that "always let the trend be your friend and never go against the trend" is just like fighting the market.
Price actionallows traders to identify the trend when it's still fresh so we can ride on it but technical analysis will not give us all instant notice on price movement and this might lead to lost of funds because when we enter a trend early we will be able to take our profit and leave before there's a change in direction.
PRACTICAL
Make 1 entry in any pair of cryptocurrencies using the Price Action Technique with the "Break-even Point" (Use a Demo account, to be able to make your entry in real time at any timeframe of your choice)
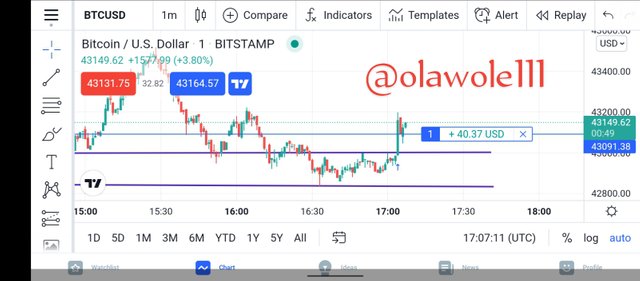
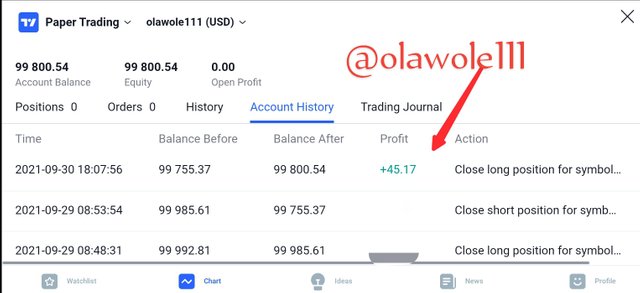
I made use of a trading view demo account to place a trade on BTCUSD, before placing this trade I made some technical analysis using price action which in no time fetched me profit.
for buy entry
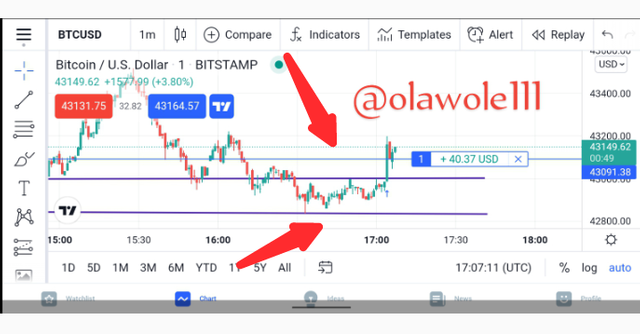
I choose my break even balance point after choosing my point I decided to Stay calm to wait for the candle to cross the candle stsick balance point ,when I noticed the candle have cross the line I the place a market execution,kept my stop loss below the candle belown the candle at the balance point and my take profit above my Balance point and a profit of $45.17 was made.
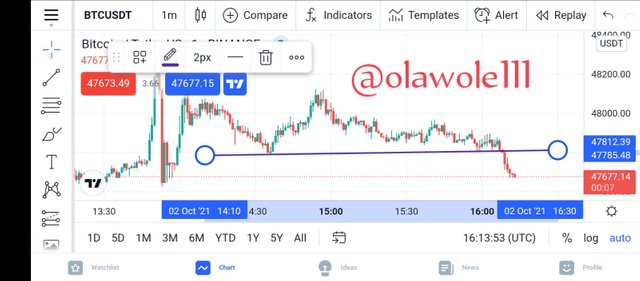
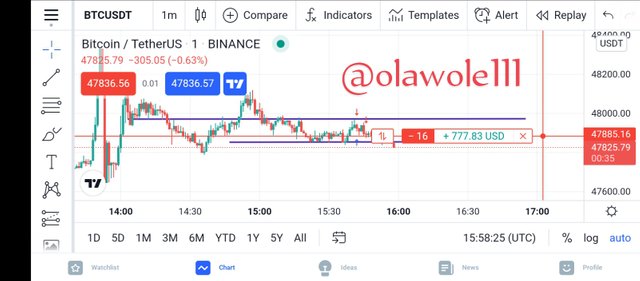
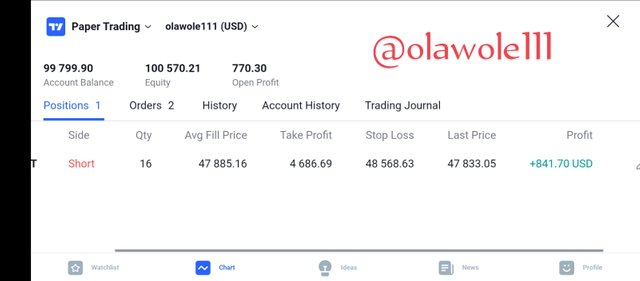
For sell entry
Sell entry is almost as same as buy , the balance point was determined and I drew a horizontal line to to denote that point, as soon a the price levels hit the breakeven I entry a sell position profit of $841.72 was made before leaving that position.
CONCLUSION
Finally, we now know that without any doubt that price action is more reliable and more efficient than technical indicator, we make use of price action in real market time while technical indicator calculate the previous movement of price which might not work most times because the indicator might give a signal why the market is giving a different signal entirely.
Thanks to professor @lenonmc21 for the wonderful lecture
NB; all screenshot used from trading view