CryptoAcademy Season 3 Week 7| Home work Post for Professor @lenonmc21 |"Analysis and Trading with the indicators "Stochastic Oscillator +" Parabolic Sar "
1.Define in your own words what is the Stochastic Oscillator?
2.Explain and define all components of the stochastic oscillator (% k line,% D line + overbought and oversold limits).
3.Briefly describe at least 2 ways to use the Stochastic Oscillator in a trade.
4.Define in your own words what is Parabolic Sar?
5.Explain in detail what the price must do for the Parabolic Sar to change from bullish to bearish direction and vice versa.
6.Briefly describe at least 2 ways to use Parabolic Sar in a trade?
_1.png)
1.It shows a step by step on how to add the Stochastic Oscillator to the chart (Indicating the% k Line and the% D Line, the overbought and oversold zone.
2.Show step by step how to add Parabolic Sar to the chart and how it looks in an uptrend and in a downtrend.
3.Add the two indicators (Stochastic Oscillator + Parabolic Sar) and simulate a trade in the same trading view, on how a trade would be taken.
1.Define in your own words what is the Stochastic Oscillator?
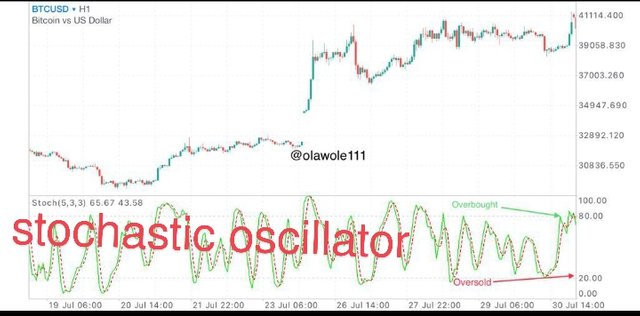
stochastic oscillator was a developed by George lane in the late 1950s, its one of my Best indicator, stochastic oscillator is a momentum indicator that help traders to determine price movement of the market, it has an over brought region and oversold region in which all cryptocurrency trader must take note of because this are the key regions of stochastic indicator, as the price move the price moves so also all the two lines of stochastic oscillator which are (% k line and the % D line) but the movement of both lines are different in which crypto trader should take very good note of the two lines one is faster and the other is a bit slower, this will be more explained below as we go one on this (report).
stochastic oscillator is an indicator that gives a trader signal's when cryptocurrency is about to do a reversal in which traders should be on the alert because it calculate all the prices momentum and what do we mean by price momentum, price momentum is a way price accelerate or decelerate in the market per time, it could be an uptrend or downtrend.
2.Explain and define all components of the stochastic oscillator (% k line,% D line + overbought and oversold limits)
% K LINE
The (% k line) is a very important line in stochastic indicator, the line could be any colour depending on the degression of the trader, its a line that has the fastest movement in stochastic indicator when it crosses the (% D line ) downward or upward it telling trader something ,I am still going to talk more on how to use this lines for trading in the next question. Its has a mathematical formula for calculations which will be show below.
%K=( H14−L14/C−L14)×100
where:
- %K = The current value of the stochastic indicator
- L14 = The lowest price traded of the past 14 previous trading sessions
- H14 = The highest price traded during the current 14-day period
- C = The most recent closing price
All this formulas are used in stochastic indicator to know the next movement of the market price that why it is called an stochastic oscillator it moves with the market any where the market moves to.
% D LINE
A (% D line ) is one of the component of the stochastic oscillator it works in line with the (% K line) and it might be any colour depending on the degression of the trader, it is a 3-period moving average line and is an extreme area or divergence point which shows turning point in the market cycle.it has some formulations which will help traders to know the way the market is moving which will be stated below.
%D = %k1 +%k2+%k3/3
Where,
%k1= 1st (3 period) simple moving average
%k2 = 2nd (3 period) simple moving average SMA
%k3 = 3rd (3 period) simple moving average
All this formulation are put together to make a better price entry.
OVERSOLD
The oversold is a region on the stochastic oscillator,where by we have 0-100 as all the region on stochastic oscillator and the oversold region takes from 20-0, when price gets to this region its already giving the sellers a reversal signal meaning the bulls are about to take over of the market.
OVERBOUGHT
The overbought region is a very important region in the stochastic oscillator,having said that the whole stochastic ranges from 0-100, the overbought regions rages from 80-100, at this region the market is telling us as traders that there's about to be a U-turn in the market the bears are about to take over the market and this tell us that we should vacate the market and be ready to take another position.
3.Briefly describe at least 2 ways to use the Stochastic Oscillator in a trade.
- ENTRY POINT : stochastic oscillator helps a trader to identify an entry point In such a way that, when we have the (%K line ) which is the fastest line crosses the (%D line) downward at overbought region its giving us a signal of an entry point, but traders should note that this indicator can't be use alone it most be combined with some other analysis (fundamental or technical) to have a very good entry.
- EXIT POINT : The exit point is a very important zone on a where trader has to be at alert.
When the (% k line )which is the fastest line enters either the overbought or oversold combined will other technical analysis.
That's tell us that we should be ready to exit the market.
4.Define in your own words what is Parabolic Sar?
**parabolic sar is an indicator that helps trade to determine the movement of an asset, this amazing indicator was developed by J. Welles Wilder. parabolic sar are dots found above and below a candlestick on a chart either on a downtrend or on an upward trend.
parabolic sar indicate when there's a change in the asset or market Price and this dots are very close to the candle, this indicator is so unique that when the dotted lines Crosses the price upward its tell us that a downtrend is about to happen and when the dotted line crosses the price downward its give us a signal that an uptrend is about to start and traders have to take note of all this little things and combine the with other indicator and technical analysis to enter a trade.
Its also know as stop and reverse(SAR) , it is called stop reversal because it tell or determine when price wants to change, when it shows all this signals traders should be ready to vacate that entry .
5.Explain in detail what the price must do for the Parabolic Sar to change from bullish to bearish direction and vice versa.
Since we all know that parabolic sar is a reversal signal,as a trader when using parabolic sar we should always watch out for a reversal and this reversal might be a bullish reversal or bearish reversal.
HOW TO KNOW WHEN PRICE WANTS TO MOVE FROM BULLISH TO BEARISH?
Price market will always show us his moves through indicators except there's a fundamental news. When price wants to move from bullish to bearish what we see on the chart is that the dotted lines goes above the price and we have to combine this with another indicator not to have fakeouts, for example we when the stochastic is lines are crossing at the overbought its giving a Strong signal.
HOW TO KNOW WHEN PRICE WANTS TO MOVE FROM BEARISH TO BULLISH
As the market Price moves it shows us some certain things that we should take not as trader and since parabolic sar is a reversal indicator what we should always watch out for always is reversals.
When the dotted line crosses below the market price it's showing us that a reversal is about to happen which is bullish reversal, though we need to confirm the reversal with other technical analysis.
6.Briefly describe at least 2 ways to use Parabolic Sar in a trade?
- Determining the Trend: parabolic sar is used to determine the trend in that when the dotted lines goes below the market Price the market tends to be an uptrend and when the price touches the dotted line above a reversal is bound to happen while its also same for downtrend is just that it's vise versa, when the dotted line goes above the market price it tends to be a downtrend and when the price touches the dotted line a U-turn is bound to happen
For Trailing Stops parabolic sar is also used for trailing stops where by traders follow the trend by moving their stop loss when a new dot forms by putting their stop loss close the now dotted line till it reverses.
Entry and Exit point: parabolic sar is used for determining entry and exit point. When the price crosses the market price below or upward it indicating a reversal which can service as entry or exit point.
PRACTICAL QUESTION (WITH IMAGES)
1.It shows a step by step on how to add the Stochastic Oscillator to the chart (Indicating the% k Line and the% D Line, the overbought and oversold zone.
I will be using meta trader 4 for my analysis
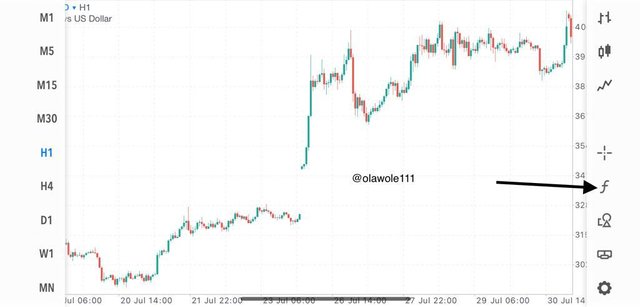
- STEP ONE Go to where f is writing on the chart at the right hand side.
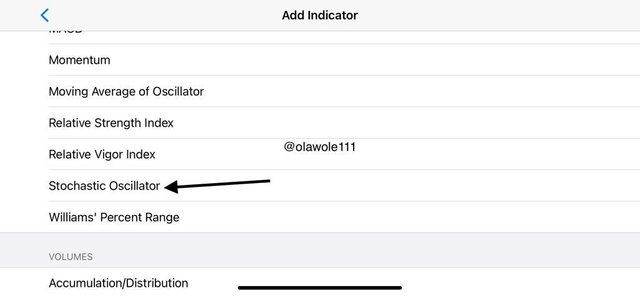
- STEP TWO : click on the main window. which indicate the plus sign.

- STEP THREE : will scroll down a little then we will see stochastic oscillator , we will click on it .
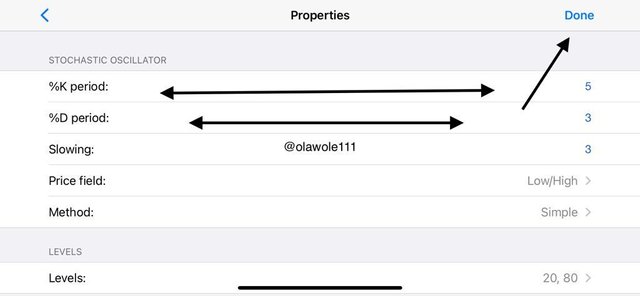
- STEP FOUR : After clicking on stochastic oscillator as we did in the previous step,if have chance to edit the periods but if we font want to edit the periods we can now click on DONE
- STEP FIVE : we will go back to the chart in which the stochastic indicator would have appeared on our chat.
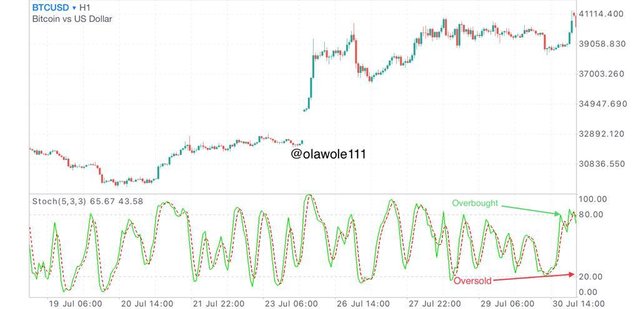
The overbought region is labelled the green arrow on the above screenshots.
The oversold region is labelled the red arrow also on the screenshot above.
The (%k line) is indicated with the green line on the stochastic indicator, which is the fastest line with 5 period (SMA).
The (% D line) is indicated with red dotted line on the stochastic with 3 period SMA.
2.Show step by step how to add Parabolic Sar to the chart and how it looks in an uptrend and in a downtrend.
I will using trading view for this analysis.
- STEP ONE : go to tradingview either the web page or the app then click on indicator at the top of the chart.
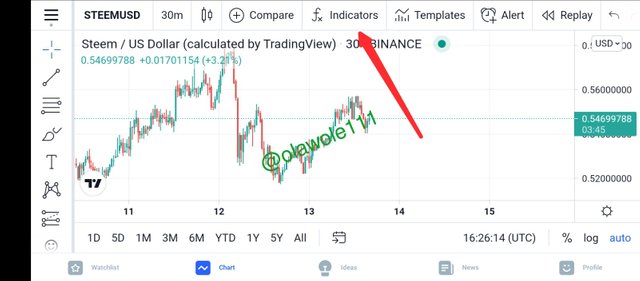
- STEP TWO: After clicking on the indicator then we go to the search box, then search for parabolic sar, after searching then we will see it at the top of the list.

- STEP THREE : After searching then we click on stochastic after clicking it will automatically appear on our chat.
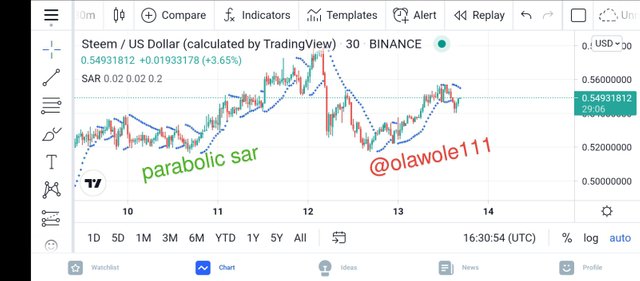
The screenshot below shows that th e green arrows facing and upward direction means the market Price was an uptrend as at that time.
while The red arrow facing downward direction is indicating a downtrend .

3.Add the two indicators (Stochastic Oscillator + Parabolic Sar) and simulate a trade in the same trading view, on how a trade would be taken.
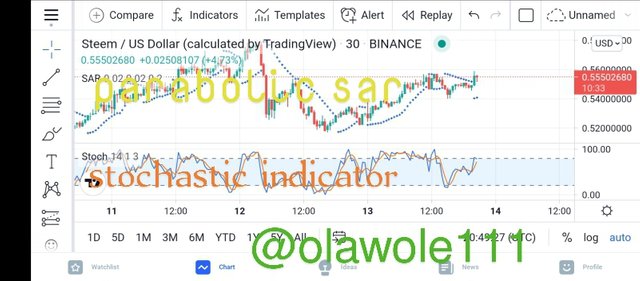
The above screenshots is the combination of parabolic sar and stochastic indicator in same chart in which we will be making some simulations on same tradingview.
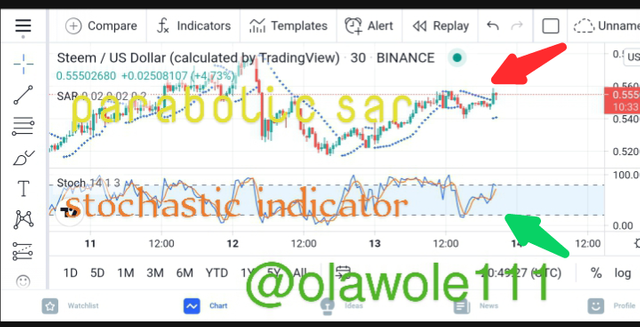
According to the screenshot above we have two arrows in which one is green and the other is a red arrow, the green is the stochastic why the red is arrow is the parabolic sar, we if we observe well we notice that at the stochastic indicator is about entering overbought region which is telling us that bears are almost taking over and the parabolic sar which is the green arrow is already crossing the Price upward and when the dotted line is above the price then a reversal is bound to happen, so as a trader I will be patient a little to confirm my entry point by allowing the stochastic indicator to enter the overbought region well and have a U-turn then and my parabolic sar should form more dots on the price(candlestick) ,then I take my entry.
CONCLUSION
parabolic sarand stochastic oscillator are both wonderful indicators and both have specific functions.
Stochastic indicator gives trades insight on how the market momentum is moving and make us know the actually trend of the market because as a trader the trend is always our friend we not go against the trend in any way.
Parabolic sar is reversal indicator which will always alert traders when to enter,leave or stay in the market,combining this Indicators with other technical analysis we would always have higher chance of winning in the market expect there's an unforeseen news.
Thanks to professor @lenonmc21 do this wonderful lecture.
Cc
@lenonmc21