Crypto Academy / Season 3 / Week 3 - Homework Post for Professor @lenonmc21 / Trends, Trend Lines and Chart Patterns /by @olawole111
Good day,professor @lenonmc21, am happy to be part of your class because a new skill added to my skills and a I notice my knowledge has increased about chart partterns and trend lines so now with I have I have learn I will be doing a homework on.
chart pattern, trends and trend lines.
write in your own words what is a "Trend"
and trend lines and what is their role in charts?
TRENDS
A trend is the general direction in market in which the values of price of an asset move.
Trends can be in two form which are;
Trends can be upwards meaning(bullish), downwards meaning (bearish) or sideways meaning ranging (flat). There is no specific timeline for a direction to be considered a trend, but overall, the longer the direction is sustained, the more stronger the trend becomes. Trend can go for hours,days,weeks,and months and real trends are found in four hours (H4) time frame and above.
And a very important thing all traders should note is that the trend is your friend and never go against the trend because going against the trend might lead to lost of funds
.png)
TRENDLINES
A trend line is a bounding line that shows and guild price movement. It is mostly formed when a diagonal line can be drawn between a minimum of three or more price pivot points. A line can be drawn between any two points, but it does not qualify as a trend line until it is tested. Hence the need for the third point, the test. Trend lines are mostly used to decide entry and exit time when trading.
A trend Line can be support or resistance trendline.
.jpeg)
A support trend line is formed when asecurities price decreases to a level in which it then rebounce at a point that aligns with at least two or more previous support pivot points
resistance trend line is formed when a securities price increases in such a way that it rebounds at a pivot point that aligns with at least two or more previous resistance pivot points.
When this two trendlines are broken it leads to a breakout.
.png)
Explain how to draw an uptrend line and a downtrend line (Show a screenshot of each).
UPTREND
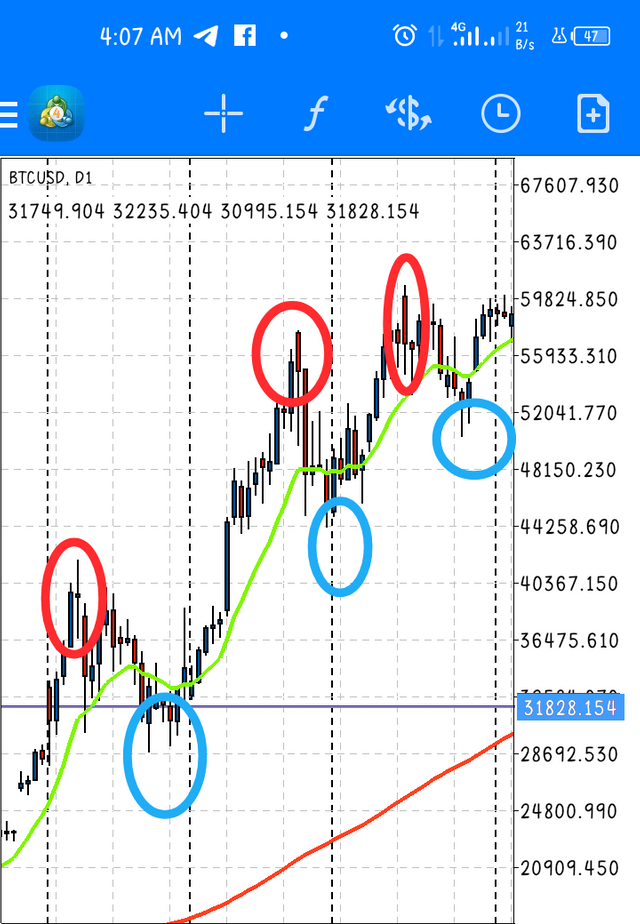
Here,this a day chart of (BTCUSD) and we have an uptrend which indicates that buyers are In control of the market, to Identify an uptrend the chart will show us higher highs (HH) which is circled in red and higher lows (HL) which is circled in blue with this we can recognize that it is an uptrend.
DOWNTREND
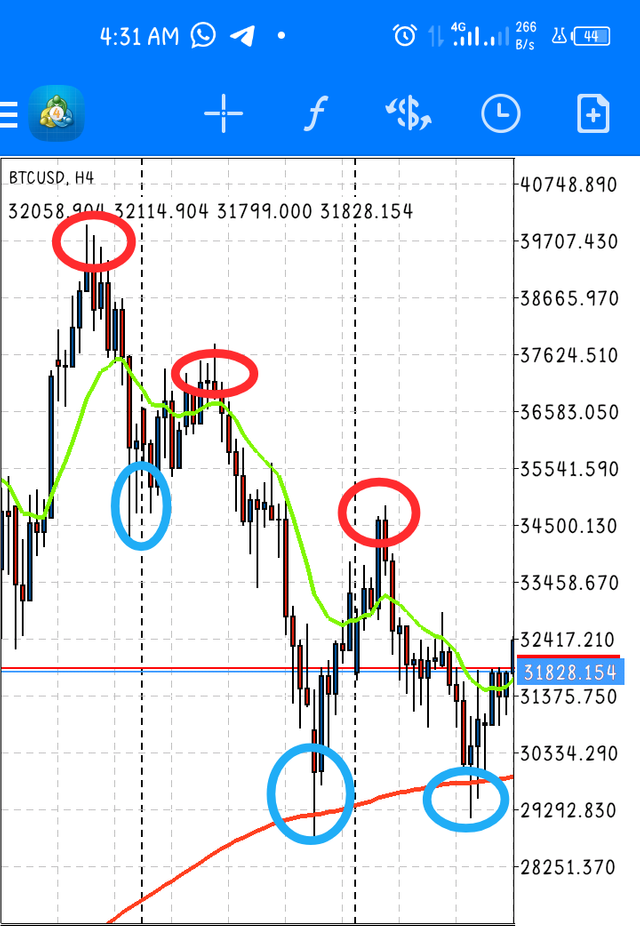
Here, we have a downtrend which indicates that the seller are in control of the market (bearish).
This is one day Time frame of the (BTCUSD) chart , to identify the downtrend the chart shows a lower high (LH) indicated red circle and lower low (LL) indicated with blue circle.
Define in your own words what "Supports and Resistances are and how we can identify both zones (Show a screenshot of each one).
SUPPORT
Support is the level where market price finds it difficult to fall below until eventually it fails to do so and bounces back up. its simply a zone or level many trading decisions are made.
Support is
Mostly viewed as a “floor” which is Holding or boucing up, prices of market. This indicates that buyers (bulls) are taking over of the market.
They are mostly found in a ranging market.
.png)
RESISTANCE
Resistance is the level or zone where price finds it difficult to break through to rise above it until it fails to and is pushed back downward. This implies reversal because the sellers (bears) has restricted the market from moving up further. They are mostly found in a ranging market.
How to identify support and resistance zones?
Step 1- Choose a chart of your choice and go to any time frame of your choice either H1,H4,D1,WK1 or MONTHLY CHART.
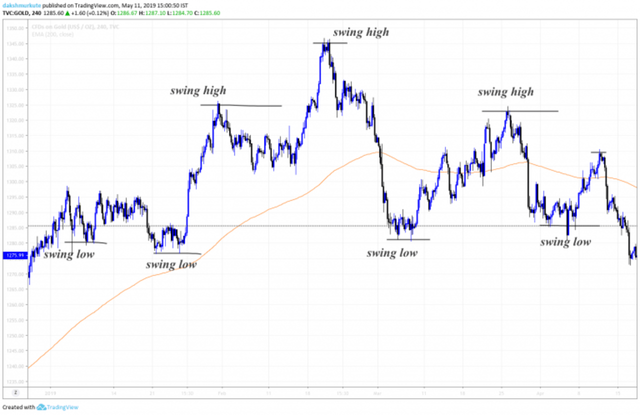
Step 2- Try to locate the area’s or regions to which the price has bounced upward or downward, or to be more presice locate regions from where the reversal happened (swing highs or swing lows). Now, mark those swing high and swing lows with a horizontal line.
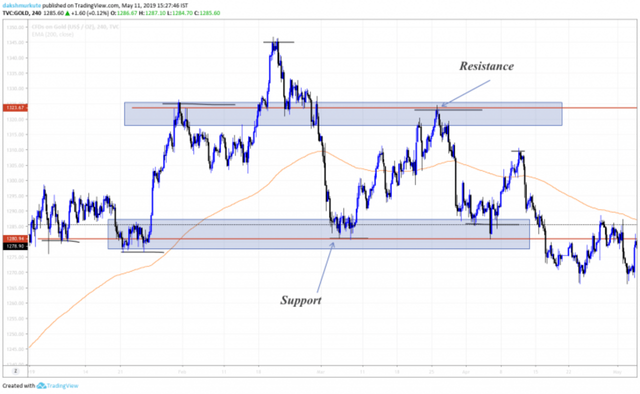
Step 3 - select a rectangle tool from the toolbox and make sure the horizontal parts of the rectangles cover as many as swing highs or swing lows that has been marked above. The rectangle region will be your Support or Resistance.
Explain in your own words at least 2 simple chart patterns with screenshots.
BULL FLAG
A bull flag is a continuation pattern that comes up due to a brief pause or ranging in the trend. The bull flag chart pattern looks like a downward sloping rectangle denoted by two parallel trendlines against the ongoing trend.
During this period of ranging, volume should dry up through its formation and resolve to push higher on the breakout. The actual price formation of the bull flag resembles that of a flag on a pole. Bull flag also consist of the flag pole and the flag it self.
.png)
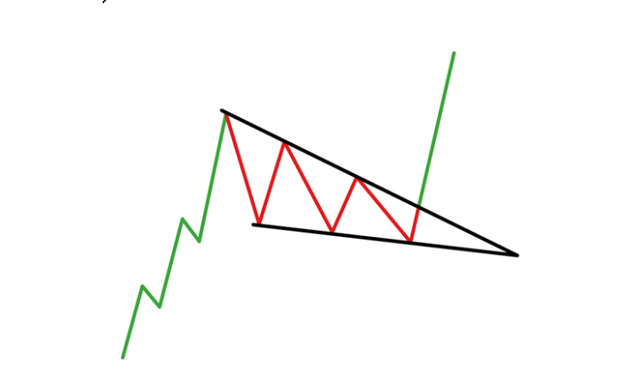
RISING WEDGE
Rising wedge can also be called Assending wedge pattern, is a powerful pattern that serve as continuation or reverser of a trend. Here trader should be very careful in placing entries because the market can go either ways.
For a reversal, trader should with for it to cross the support line and thereafter show a conformation candle and a retest.
For continuation, when the candle crosses the resistance line thereafter a retest then it's continuation.
CONCLUSION
Having gone through the lecture, I have learn a lot from your impactful lecture and a glad to participate in the homework it widens my knowledge about trends and chart patterns,
Thanks so much @lenonmc21
N.B: The un sourced screenshots are from Mt4 trading platform