Steemit Crypto Academy Season 4 | Intermediate course by @allbert –week 5: Trading with Accumulation / Distribution (A/D) Indicator.
Thank you, Prof; @allbert for another class well explained.

1. Explain in your own words what the A/D Indicator is and how and why it relates to volume. (Screenshots needed).
The accumulation distribution (AD) indicator line is a volume-based indicator useful for determining the stock trend, by using the relation between the stock’s price and volume flow. The term “accumulation” indicates the buying level (demand), and “distribution” indicate the selling level (supply) of a stock. From here, based on the liquidity pressure of stock, you can predict the stock’s future price trend.
The major rule stated for the A/D indicator as gotten from a research is that the stock volume goes before stock price.
[Source]
The number of shares that were traded is relative to the rise and fall of its stock price. The Accumulative Distribution (A/D) indicator, predicts the direction of the volume flow like other volume indicators. It helps to determine future stock price movements and then provides an edge.
How and why A/D relates to Volume
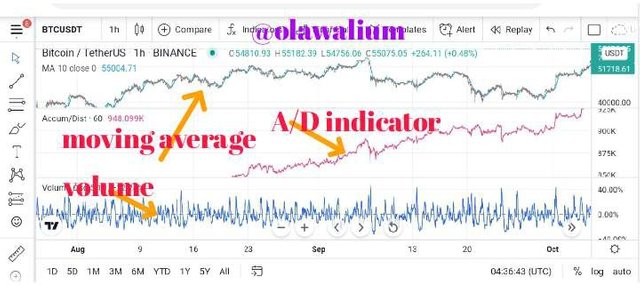
They both relate since they are both in the box under the price bars. They can be positive or negative values while they swing around a zero line. You'll know if there is a purchase pressure (accumulation) or selling pressure (distribution) through the A/D line. Hence, you can predict the movements of the price based on the supply and demand for the asset.
screenshot from TradingView & edited with PicsArt by me
The difference between them is how they move, Volume swings up and down, it follows the price and they both react to a small price.
2. Through some platforms, show the process of how to place the A/D Indicator (Screenshots needed).
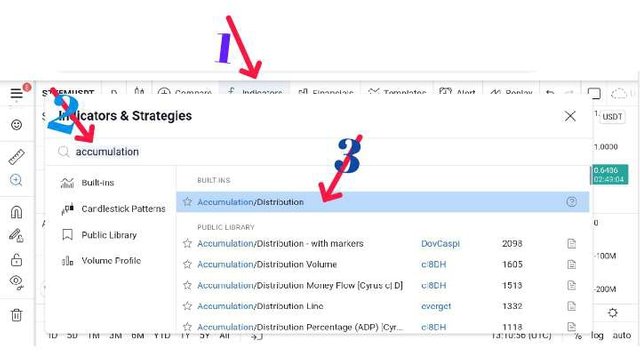
To place the A/D indicator, on TradingView, launch a chart then click on the "fx" or indicator, after that, search for "accumulation".
screenshot from TradingView & edited with PicsArt by me
screenshot from TradingView & edited with PicsArt by me
3. Explain through an example the formula of the A/D Indicator. (Originality will be taken into account).
There are 3 parts of the A/D Indicator formula:
A. Money flow multiplier (MFM)
B. Money flow volume (MFV)
C. Accumulation distribution line (A/D line)
Here’s the breakdown:
Formula for Money Flow Multiplier (MFM) = ( (Close Price - from Low Price ) - (High Price - Close Price) / (High Price - Low Price)
Accumulation/Distribution Indicator (AD) = Previous Period AD + Current MFV
Formula for Money Flow Volume (MFV) = MFM multiply by Volume for the Period
The formula for the money flow multiplier (MFM) is +1 and -1 range. If the closing price is in the lower half in between the high and the low price, then, the MFM is negative but if the closing price is in the upper half in between the high and the low price, then the MFM is positive. This value gives discernment into purchasing and selling grievance of that security.
When there is more essential buying pressure, it means a Positive money flow multiplier (accumulation). That pressure should then correlate with a rising price in turn. The reverse is the negative case in MFM.
A/D = Previous A/D + Current Period’s Money Flow Volume.
MFV = Money Flow Multiplier × Volume for the Period.
MFM = [(Closing Price - Low) - (High Price – Closing Price)] / (High Price - Low Price)
For Example:
Let's assume that:
Close Price = $506
Low Price = $402
High Price = $309
Money Volume for Current Period = 9,700
Previous Period AD = 150,000
I'll make use of the 3 components of the formula:
MFM = ((Close Price – Low Price) – (High Price – Close Price)) / (High Price – Low Price)
MFM = ((506 – 502) – (309 – 506)) / (309 – 402)
MFM = (4 – 3) / 93
Money Flow Multiplier = 1 / 93 = 0.010752688172043
MFV = MFM × Volume for the Period
MFV = ((1 / 93) × 9,700)
Money Flow Volume = 104.3
AD = Previous Period AD + Current MFV
AD = 150,000 + 104.3
A/D indicator = 150,104.3
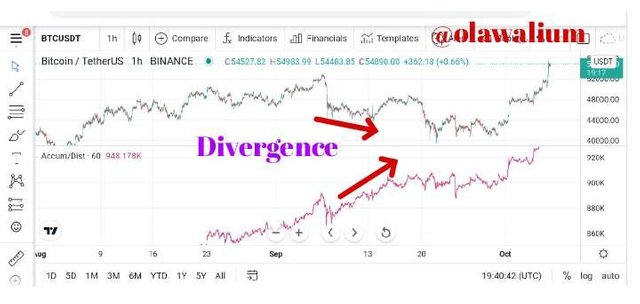
4. How is it possible to detect and confirm a trend through the A/D indicator? (Screenshots needed).
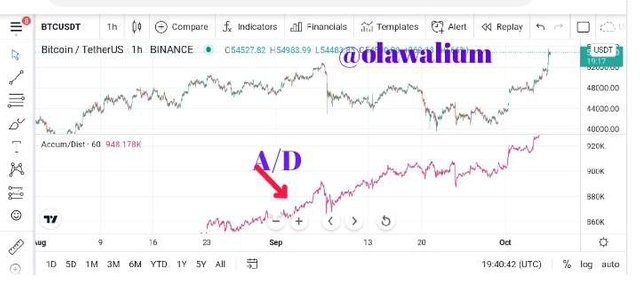
A/D indicator is a line in a box under the price bars. It can be positive or negative values while it swings around a zero line. You'll know if there is a purchase pressure (accumulation) or selling pressure (distribution) through the A/D line. Hence, you can predict the movements of the price based on the supply and demand for the asset.
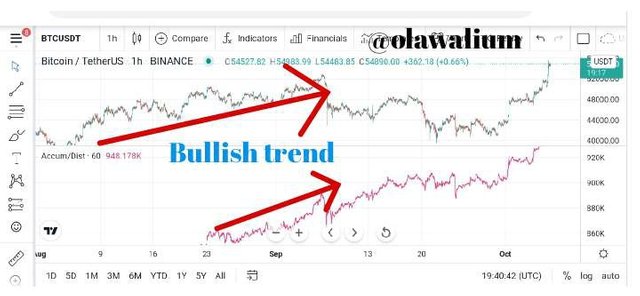
To confirm a trend, when you notice that the price and the indicator form higher lows and higher highs then it is an upward trend. A bearish trend is expected to happen when the price and the A/D indicator shape lower lows and lower highs.
screenshot from TradingView & edited with PicsArt by me
screenshot from TradingView & edited with PicsArt by me
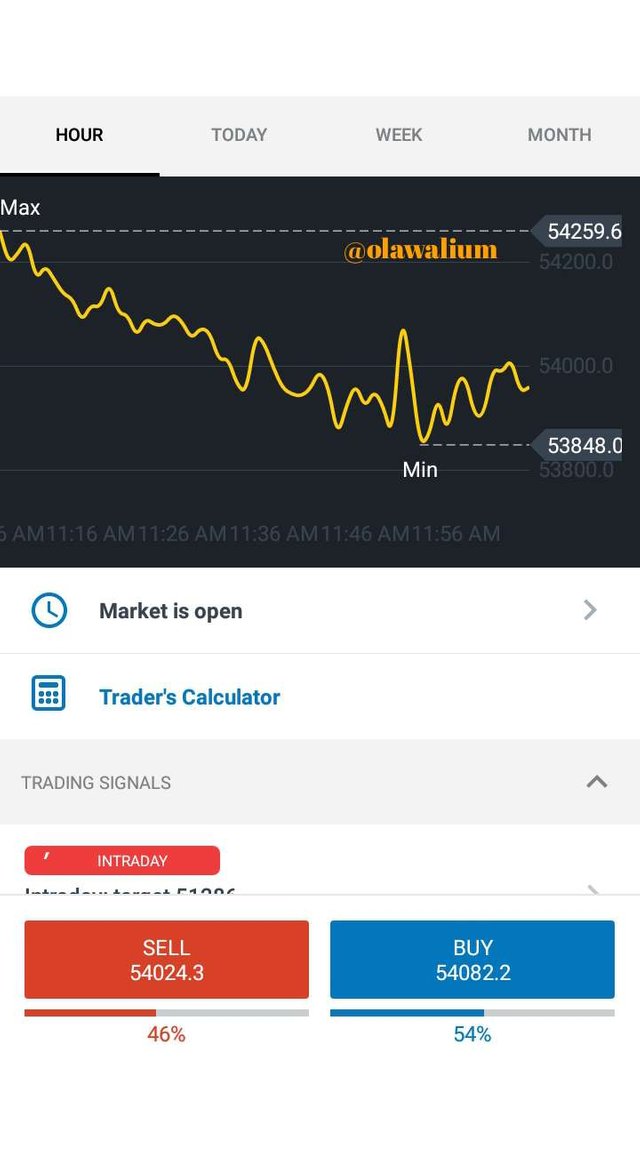
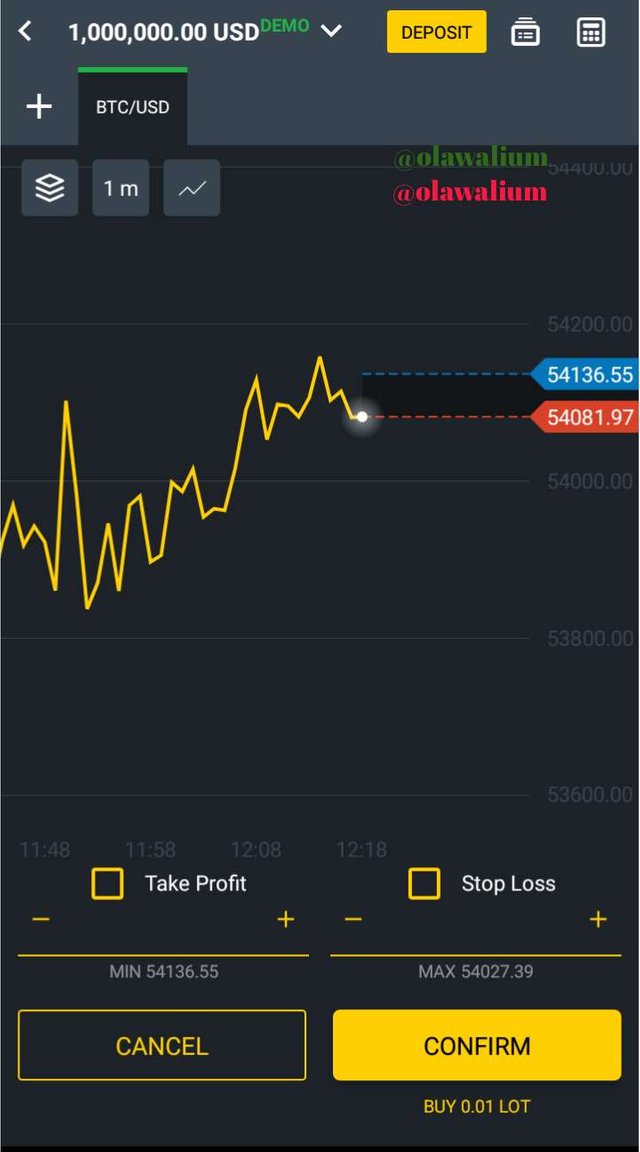
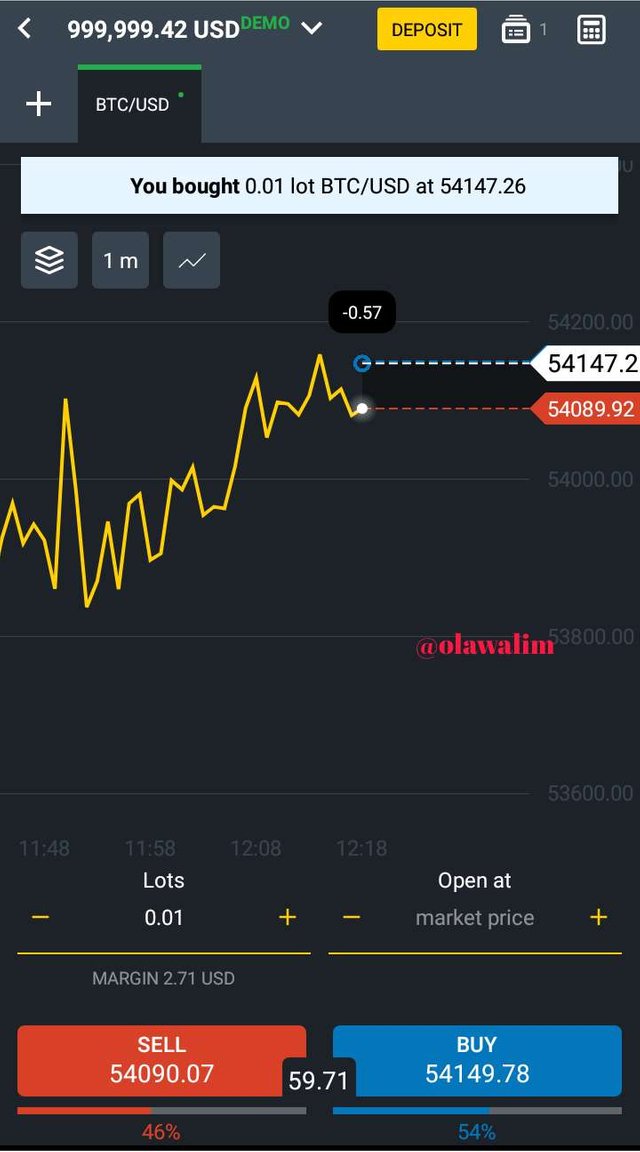
5. Through a DEMO account, perform one trading operation (BUY or SELL) using the A/D Indicator only. (Screenshots needed).
screenshot from TradingView & edited with PicsArt by me
In this chart above, the price and the A/D are moving up - Bullish, so it's not time to sell, the best option is to buy.
screenshot from Exness trading DApp & edited with PicsArt by me
screenshot from Exness trading DApp & edited with PicsArt by me
screenshot from Exness trading DApp & edited with PicsArt by me
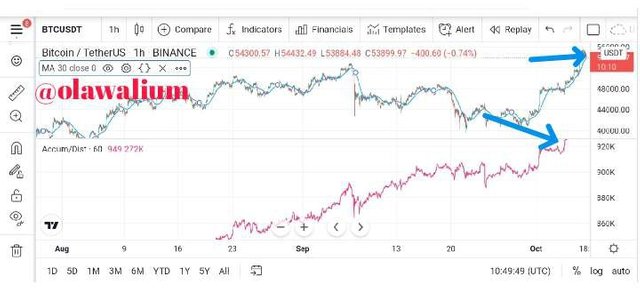
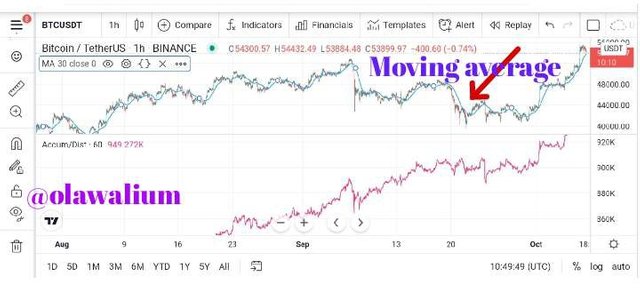
6. What other indicator can be used in conjunction with the A/D Indicator? Justify, explain and test. (Screenshots needed).
You can use the moving average indicator with the A/D indicator. Even if A/D react to a small price, the moving average would show its small price through its movement with the price.
screenshot from TradingView & edited with PicsArt by me
Conclusion.
The accumulation distribution (AD) indicator is a useful tool for traders while trading, although it follows all prices even it's a small price and it's still not bad, at least it indicates where profit and loss are likely to happen. But if another indicator that didn't have the same feature with A/D is added to it on a chart, traders would identify the small price and the big one.
References:
Plagiarism report:
Thank you for your time.
My pen doesn't bleed, it speaks, with speed and ease.
Still me,
My tongue is like the pen of a ready writer.
Olawalium; (Love's chemical content, in human form). Take a dose today: doctor's order.