[Heikin-Ashi Trading Strategy]-Steemit Crypto Academy | S4W2 | Homework Post for @reddileep
Special thanks to @reddileep for this wonderful class and making it as direct and easy to relate to as possible. It was enjoyable and thank you.
Now, let's get down to brass tacks...
pixabay
1. Define Heikin-Ashi Technique in your own words.
Heiken Ashi is a Japanese word, it means average bar. Heiken Ashi indicator amends how price values are shown on a chart.
The Heikin-Ashi based on technical trading, it's a tool by the Japanese, it make use of candlestick charts to compose and envisage price data of market. It is useful for identifying trend signals of the market and predict price movements. Heikin-Ashi method make use of average price data, this data helps to sort out noise of the market.
Since there is no market noise, then it would result to a market illustration trends and direction that helps to determine the potential price movements. The trader got assistance from the trading technique by helping them know when they should move on with a trade or wait a little bit, or know if a reversal is about to happen. Traders can just change their positions, i.e., either to avoid making losses or lock a profit on the chosen position.
2. Make your own research and differentiate between the traditional candlestick chart and the Heikin-Ashi chart. (Screenshots required from both chart patterns).
Heikin-Ashi
Traditional candlesticks
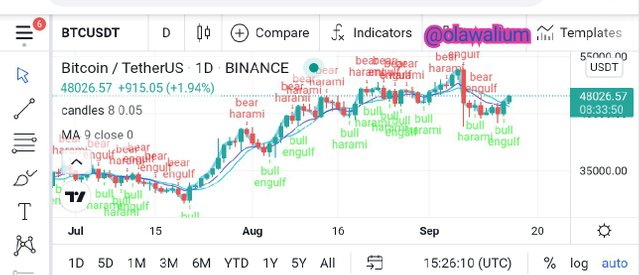
The traditional candlestick charts often change from green to red which can make them hard to interpret but the candles on the Heikin Ashi chart shows more following coloured candle, which helps traders to know the past price movements easily.
The Heikin Ashi charts can make its candles remain green when there's an uptrend and change to red colour when it's downtrend but even if the price moves strongly in a direction, traditional candlesticks stays in alternate colour.
The Heikin Ashi chart has smooth look when it comes to price action and it is more of the reason why some traders use it's candles since it reduce smooth the colour on the chart, and let's them to make analysis on trends but it's contracts to traditional candlesticks, the colour stays, it doesn't change.
The way that the price is displayed in open and close differentiates Heikin Ashi and traditional candlestick chart.
Each of the candlestick of Heikin Ashi starts from the middle before it, it doesn't start from the level where the past candlestick has already closed and reason it act this way is because of the way they are calculated.
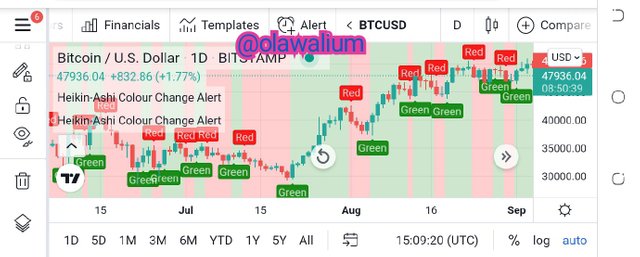
Heikin-Ashi changing colour
Traditional candlesticks
3. Explain the Heikin-Ashi Formula. (In addition to simply stating the formula, you should provide a clear explanation about the calculation).
Like a traditional candlestick, Heikin Ashi candle has high, low, open and close. So, Heikin Ashi formula is four:
Heikin Ashi candlestick's open is equals to the midpoint of the past candle. And all the new candlestick begin from the middle of the past one.
Today’s Heikin-Ashi candle uses today and yesterday data candles. In this way, HA candles smooth the action of the price.
The Heikin-Ashi data can come in various time frames, it may be monthly, weekly or daily, etc. Heikin Ash Open is mostly set to the segment of the body of the past bar, and the Heikin-Ashi Close is computed as the average price of the present bar. The Heikin-Ashi High has the highest value in the the present high, Heikin-Ashi Open, and Heikin-Ashi Close. Heikin-Ashi Low is the lowest value in the current low, Heikin-Ashi Open and Heikin-Ashi close.
In the formula, we make use of the open close data from the past period and the OHLC (open, high, low and close) data from the present period. Changed OHLC values are shown as candlesticks.
High is equal to the Maximum of High, close or open (the highest one of them).
Low is equal to the Minimum of Low, Open, or Close (the lowest one of them).
Open is [Open (the past bar) + Close (past bar)] /2.
Close is (Open + High + Low + Close) / 4.
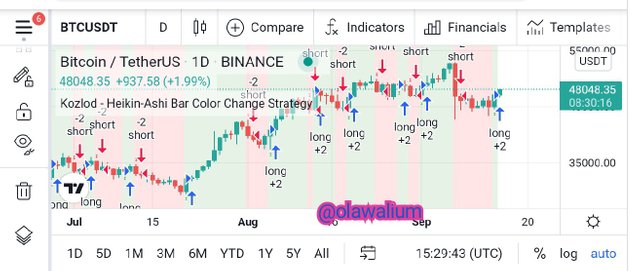
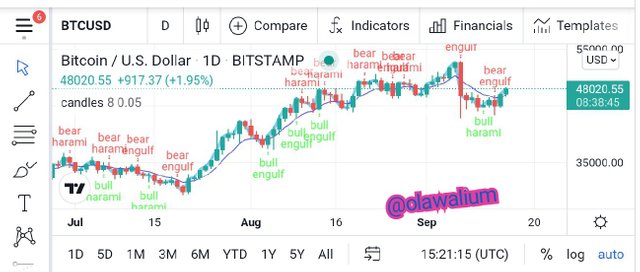
4. Graphically explain trends and buying opportunities through Heikin-Ashi Candles. (Screenshots required).
On chats, even if it's not Heikin-Ashi candle, the buy and sell opportunity or chance would show in the chart, either to buy or to sell.
When the chart shows that there's tendency for the cryptocurrency to rise, that's when you need to buy and when the chart shows that the price may fall, that's when you need to sell.
Heikin-Ashi candle shows clearly when to sell or buy in the chart, so in the chart above, I explained the trend and buying opportunity with arrow point.
5. Is it possible to transact only with signals received using the Heikin-Ashi Technique? Explain the reasons for your answer.
Yes it possible to transact only with signals received using the Heikin Ashi because it's a type of price chart that uses averages to show movement of price of an asset. It's chart that is useful in form of technical analysis to look at price movements of an asset with gaze to an whole trend. So, as you are able to see the whole trend clearly, then you can make a better choice decision about whether to go on in a trade or to exit a trade.
Just like the traditional candlesticks, Heikin Ashi candles will display four different price levels; low, high, Open, close, but it will make use of the data derived from the present and past session to obtain their values. So, HA charts can be put into the same time values like the traditional candlestick charts, which makes them useful as part of day trading strategy and make a transact decision.
HA can be read with colour. The Heikin-Ashi chart candles colour is always red when it's a downtrend and has green during an uptrend, with this, you can make transaction decision; either to buy or sell or either to enter trade or exist trade.
With the chart that has very smooth directional signal moves, including more consecutive bars of the same colour which shows clear picture in the price movements, you can make transaction decision.
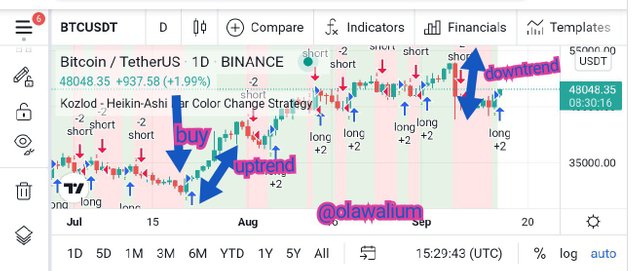
6. By using a Demo account, perform both Buy and Sell orders using Heikin-Ashi+ 55 EMA+21 EMA.
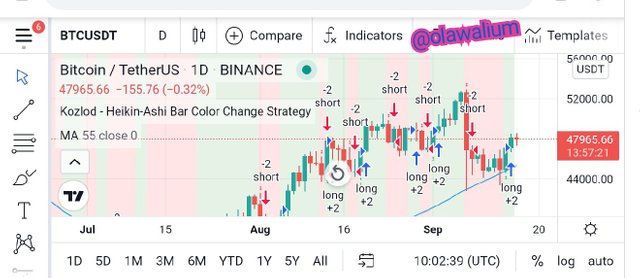
55 EMA
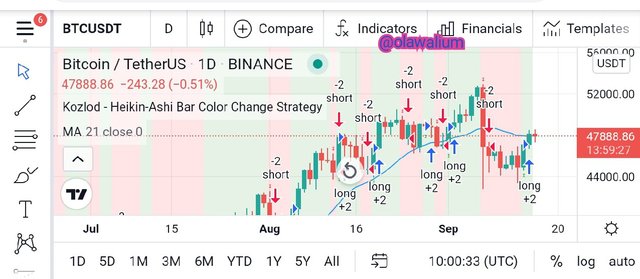
21 EMA
The two chats above shows different EMAs
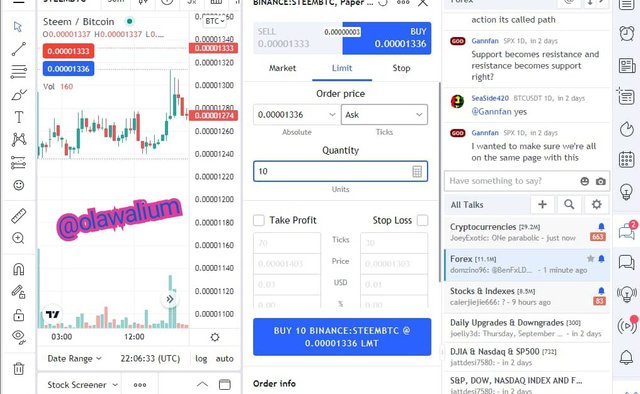
Sell
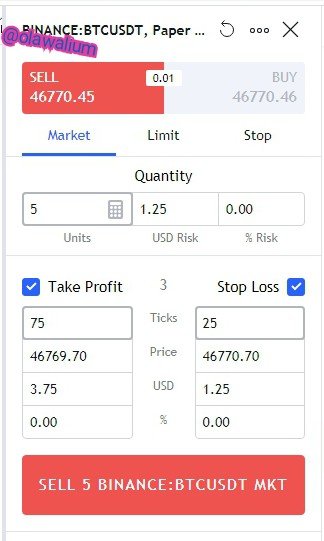
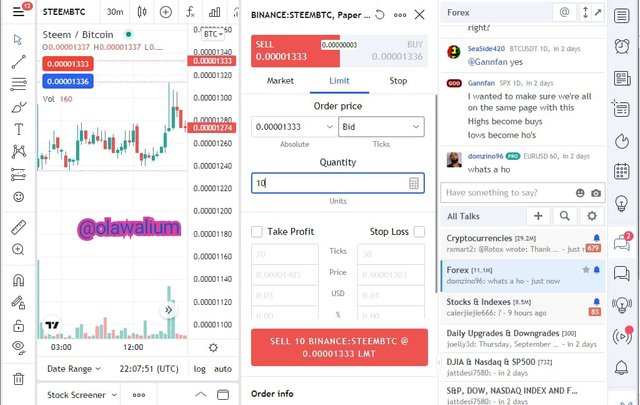
Buy
CONCLUSION.
We have different types of indicators with their different features, it's the one that trader is familiar with - the one suitable for the trading he's on, he would make use of. Heikin-Ashi is just an advanced level of the traditional candlesticks; it's calculated in almost the same way and same formula. They both have OHLC , only the colour noise and colour changing is the real difference in them
NB: The charts I use in this assignment is from TradingView and I edited it with Imarkup application myself.
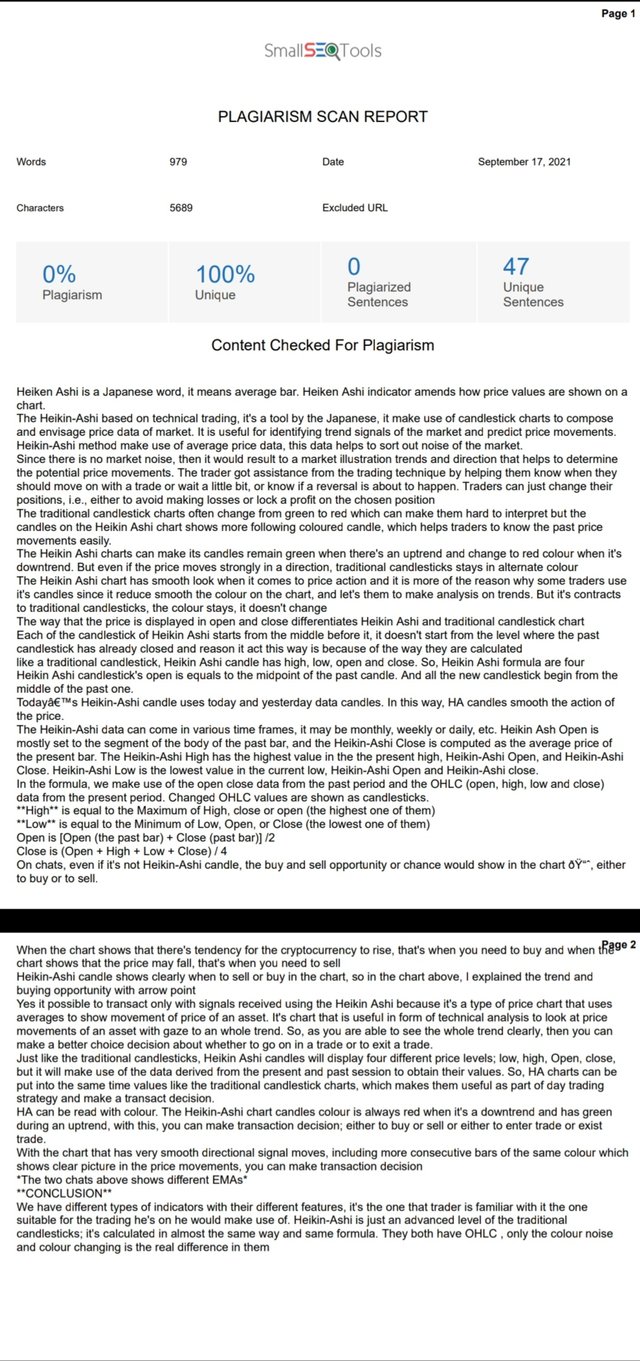
Here is the Plagiarism report for this assignment:
Thank you for your time.
My pen doesn't bleed, it speaks, with speed and ease.
Still me,
My tongue is like the pen of a ready writer.
Olawalium; (Love's chemical content, in human form). Take a dose today: doctor's order.