Crypto Academy Season 4 [ Advanced course ] week 2: Crypto Trading With Volume Indicator.
Thank you, Prof; @kouba for this detailed and extensive lecture. Thank you for taking that much time in explaining. It helps a lot.
1. Explain the volume indicator in your own words.

pixabay
Volume indicator points out the price changes number within each length of time selected timeframe. The bars of the volume indicator is always green if they are bigger than the past ones and turn red, the volume declines.
Volume indicator is a necessary technical indicator that is needed on all cryptocurrency price chart because it's an indicator that goes in line with the number of assets that is traded on a length of time. Volume is a key indicator in the activity of the market and its supply and demand.
Volume indicator information is always represented by plumb line columns at the bottom of the graph. If you find bars that are high in volume, it means that there was more activity of trading during the period in question, smaller columns point out a lower trading activity.
In balance, a form line represents the indicator. If the current candlestick price closes, the price is higher than the previous one, then the current volume would be added to the past OBV and the line moves up but if the ongoing candlestick close price is lower than of the past one, then the current volume is minus from the past OBV which will make the indicator go down. It’s suggested that OBV changes in forego price changes, so it can give signals.
2. Use a platform other than Tradingview to present the volume indicator on a chart and show how to configure its parameters by justifying your choices. (Screenshot required)
Although Binance offer a live market but since it's just to demonstrate how to add indicator; volume indicator to be precise, then I'll make use of Binance trade.
Below I'll show step by step how to make use of Binance trade and add volume indicator.
The first step, go to binance.com and click on trade:

After then, an option would display, just click on advance:

Then the chart would appear:

See where the indicators are in my screenshot below:

Click where the point is, then search "Volume":
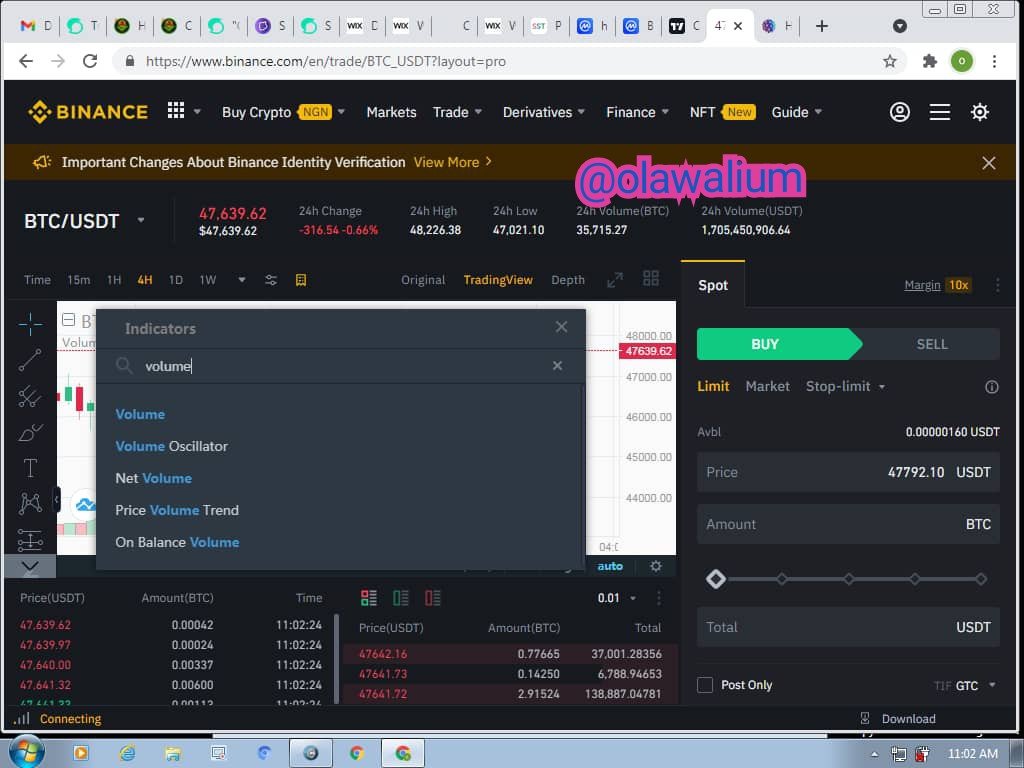
To configure the parameters, just go to the settings then select the parameters you want to configure.


3. What is the link between Volume and Trend and How to use volume to predict a trend reversal? (Screenshot required)
The relationship that's between Trend and Volume reveals whether volume confirms the entire trend or if it gives a warning of an upcoming reversal. -
Source
Commonly, volume is supposed to increase in the direction of the trend. In the rising trends, what we want is high volume on rises and near tops, we want low volume on falling prices or no fall in prices if it's possible and near bottoms. Volume and Trend development call traders attention to a healthy stock with investors and give strength to an all-encompassing positive trend.
Likewise, If the price is falling high, and near bottoms in a falling trend, it will confirm the all-around negative trend and indicate that it will keep falling.
Volume creates a chance to understand the price change source and assure or deny a given trend quality and trend direction. The volume shows when professional investors with the huge purchase and sell stocks. No increase in turnover when it overcomes an important price level which might be a pointer for the false signals that's coming from the market, it might reveal that smart money is attempting to supply stocks at a low cost.
Many scientists have a focus on the observations of the relationship that's in between trading volume and trend which has been on-going for the last few years now. Traders and technical analysts expect that price changes are positively mutually related with volume; so, the volume is supposed to increase when there is an upward trend and suppose just decrease when it's downtrend correction. In contrast to that, during a downtrend, the volume is supposed to increase as the prices decline and it should decrease as the growth increases but findings are yet to be confirmed fully. The price of the volume might change, it depends on the market information and the assets considered
To predict trend reversal.
High volume simply means it's a bullish season and low volume means it's a bearish season in the market.
Uptrend

in this screenshot, as the price moves uptrend, the volume follows
Downtrend
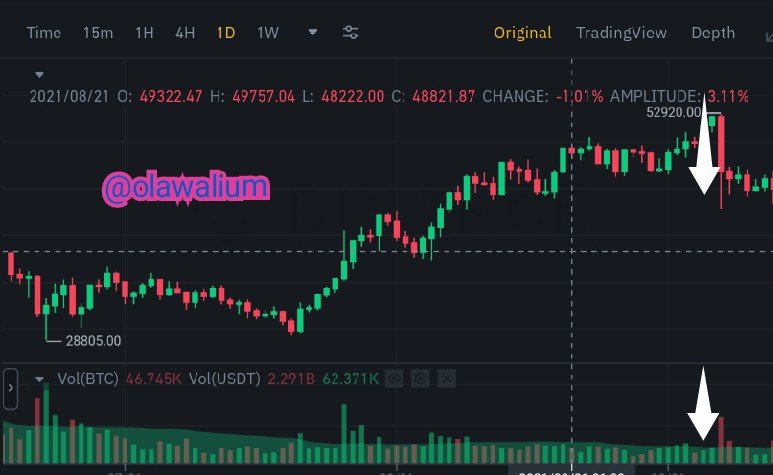
As the price moves downtrend, the volume follows
But in any case, that price is decreasing and volumes keep increasing, it indicates that there is a strong decline in the price and market and it's bearish.
4. How to use the volume to have a signal confirmation? (Screenshot required)
You explained that Volume divergence happens when prices reach a high on a falling volume, and it indicates that there is a decrease in buying pressure so If the volume increases after a little correction, then the uptrend may stop.
The volume supposes to show the price movement in the charts. So, to have a signal confirmation, you have to consider two points, which are;
Support breakout with falling prices
Resistant breakout with raising prices
Support breakout with falling prices.
In the event of a support breakout, it is necessary to watch the trade volume, because the low volumes will put pressure on the downtrend.
In fact, if the exchange volume is weak during a break in support, the reason why is because the buyers are not enough.
There will be divergence we have many highs with decreasing volume, it notifies that there's a decrease in buyer, then if volume increase to a peak, it could be a sign of reversal.


Notwithstanding, if the support is broken with high volume, it warns that there's a strong downtrend.
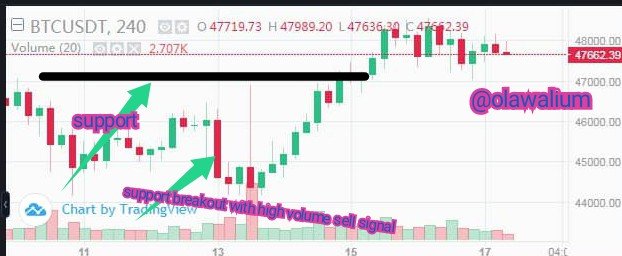
screenshot from Binance
Resistance breakout with rising prices.
If the breakout has low volume, then there is an elevated probability that a correction will come later as the low volumes reveal that the buyers never could support the prices.
So, it is necessary to check the way you trade because that crossing resistance goes with high volumes.
5. How does the volume reflect the evolution of prices in the charts and why does the volume sometimes anticipate the price? (Screenshot required)
The volume rise will predict the price. A trend line is made by watching the multiplicity of resistance and the support points. Accordingly, it is possible to estimate the price.
We compute the trading volume by multiplying the number of transactions of the asset that's subject to the transaction with the purchasing and selling prices. When the volume increases on the chart, trading analysts think it's time to buy with more confidence and trade on the values.
The more the trading volume is in a trade, the more the asset changes hands and the increase in the transaction volume can be positive or negative, depend on the increase in sales.

screenshot from Binance
6 Is it better to use the volume indicator alone or use it in parallel with another indicator when trading? Justify your answer.
Even if it's not a Volume indicator, one indicator on a chat cannot give any result, so it's best to make use of two and if possible 3. No, the volume indicator cannot be used alone, it goes with another indicator before it works. We can make use of RSI indicator, Adx indicator with Volume indicator to have a better result or more make the chart reliable.
The other indicator we add with the volume indicator would support the forecast and show where profit is and where loss may come up. Some indicators are even able to get to know future trends.
7. The volume indicators are multiple, choose one of them to briefly explain its usefulness in crypto trading.
On-Balance indicator, Volume RSI, Volume Price Trend Indicator, Money flow index, Chaikin Money Flow Indicator, Accumulation/distribution, Ease of movement, Negative volume index and Volume Weighted are the 9 types of indicators. I'll talk about Easy Movement
Ease of Movement indicator is a necessary volume indicator that helps in measuring ‘ease’ with a movement of the stock price in between different levels based on volume trends. Easy moving price is the one that carries on in its trend for a particular period.
Easy Movement indicator works in volatile markets best, it works where the trends are not clearly seen.
Easy movement spawn buy and sell signals whenever it crosses the 0 line in the centre or makes a bearish or bullish difference.
This indicator becomes best when it's used for long time frames, just like a daily chart as it knows trends based on volume averages.

screenshot from TradingView
Conclusion
No matter how good an indicator is, it can't work alone, it has to work with another indicator before it works. So, the volume indicator is amazing, traders that avoid volume indicator are a novice. With the nine types of volume indicators and their features, it can't fail a professional trader.
Reference: https://www.investtech.com/main/market.php?CountryID=44
Thank you for your time.
My pen doesn't bleed, it speaks, with speed and ease.
Still me,
My tongue is like the pen of a ready writer.
Olawalium; (Love's chemical content, in human form). Take a dose today: doctor's order.
Unfortunately @olawalium , your article contains plagiarized/Spun content
Rating Total|0/10
Source:
https://link.springer.com/article/10.1007/s40822-021-00166-5
The Steemit Crypto Academy community does not allow these practices. On the contrary, our goal is to encourage you to publish writing based on your own experience (or as per the mission requirements). Any spam/plagiarism/spun action reduces PoB's idea of rewarding good content.
Thank you.
Cc: -@endingplagiarism @sapwood