Crypto Academy /S4W8-Homework Post for @kouba01.
A well detailed class... Thanks, Prof; @kouba01.

pixabay
1. In your own words, give an explanation of the ROC indicator with an example of how to calculate its value? And comment on the result obtained.
The Rate of Change (ROC) indicator is also known as simply Momentum. It is a pure momentum oscillator which measures the change per cent in price from a period to the next one. Calculation of ROC is the comparison of current price with price “n” periods ago. The plot forms an oscillator that swings above and below the zero line as the ROC moves from positive to negative. ROC signals are overbought-oversold, centerline crossovers, divergences and readings, as a momentum oscillator.
The Rate of Change (ROC) is a price based indicator made to measure the rate at which price changes from a period to another one. The current price measurement in connection to a defined look back period is the typical definition rate of change. So, when we express it as a percentage, ROC is made to help traders determine momentum, not only that, it still helps in overbought and oversold conditions and direction of the trend. ROC is a momentum oscillator; other indicators like ROC are ADX, MACD, and RSI.
ROC calculations
ROC is calculated in a way that traders can have assessed how the price has recently changed compared to a defined retrospective period. The rate of change formula is:
ROC = [(Current Close - Close n periods ago) / (Close n periods ago)] × 100
For instance, if a stock's price after today's trading is 10 dollars, and the closing price five trading days anterior was 7 dollars, then the five days ROC is equal to 42.85. See how it's calculated bellow:
( ( 10 - 7 ) ÷ 7 ) × 100 = 42.85
‘n’ is a ‘user’ defined number that represents the periods ago number that the price is being compared to.
In most platforms, default ‘n’ is 14, but many traders commonly use 9 and 25. On many occasions, the longer-term traders always choose a period that's as large as 200. when smaller numbers react to prices faster, it may lead to false signals. On the other hand, large numbers do react slowly when price changes which may cause ROC to smooth and it may lead to signal that's reliable when they happen. It is necessary to know the nature of volatility of the underlying asset to be able to analyse it.
Some traders can also make use of shorter ‘n’ values on higher timeframe charts like daily and more, and they can use longer ‘n’ values on low timeframe charts like an hour and below 1 hour.
2. Demonstrate how to add the indicator to the chart on a platform other than the tradingview, highlighting how to modify the settings of the period(best setting). (screenshot required)
I make use of Bittrex; bittrex.com
To make use of the bittrex platform in adding indicators, it requires steps, which may look odd to anyone who didn't understand it.
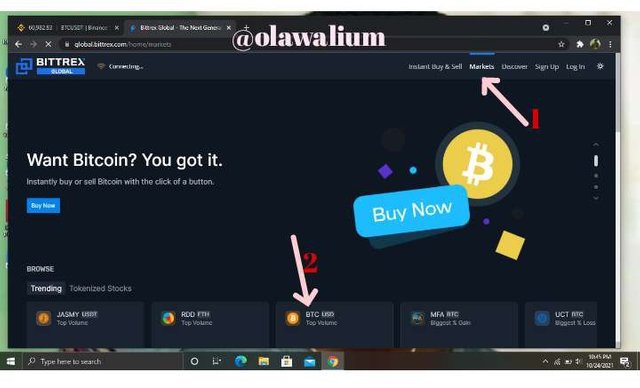
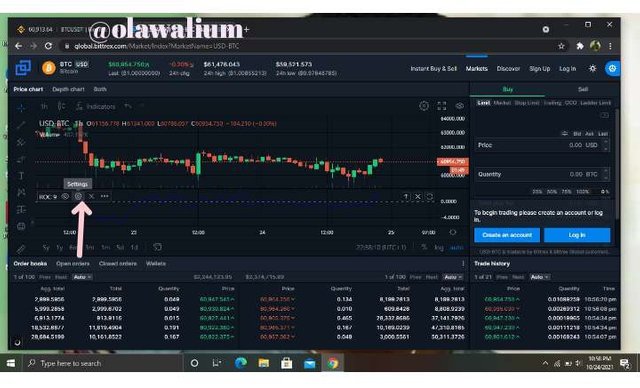
Bittrex home view
To launch a chart, click on "Market" then choose a market of your choice in the different markets below:
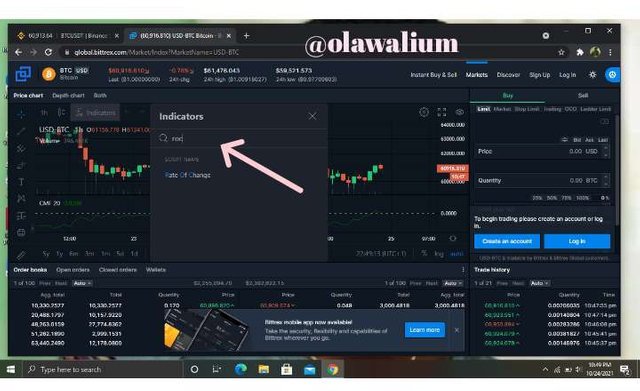
After the chart is launched, click on indicator then search for "ROC"
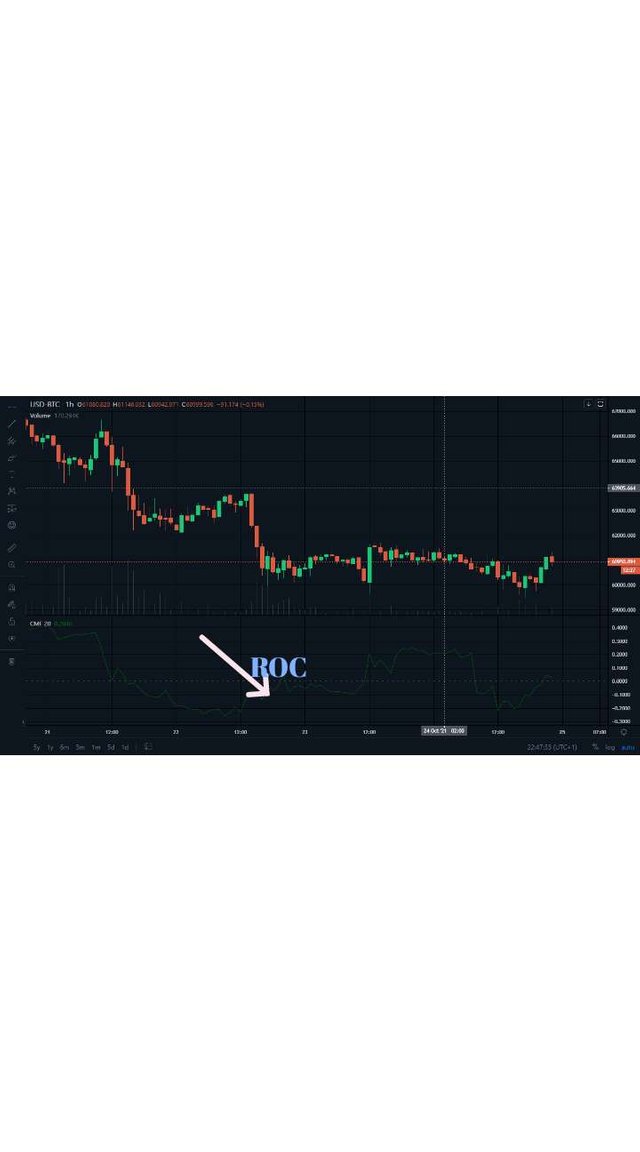
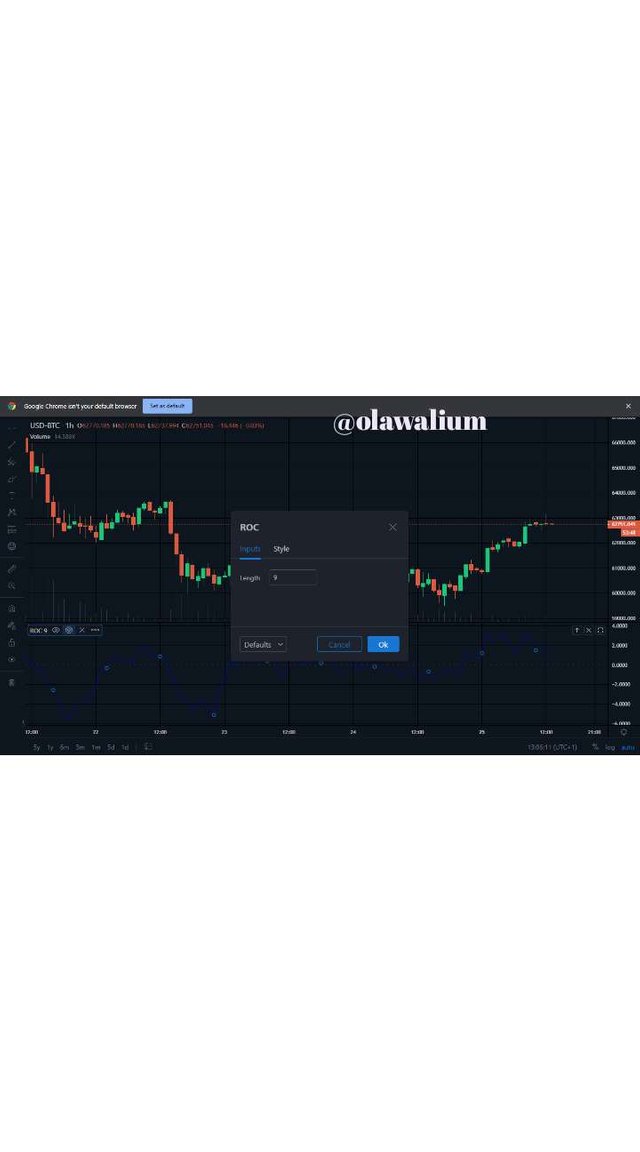
How to modify the settings of the period.
There are many settings that we can use for ROC but, the common settings for this indicator is 9 periods. Some traders settings 14 and 25 as well.
What's important for the readers to know is that there is no perfect number that can magically give the best settings.
To make the settings, click on where the indicators option is and then click on setting.
Since the common period is 9, then I didn't bother to change it.
3. What is the ROC trend confirmation strategy? And what are the signals that detect a trend reversal? (Screenshot required)
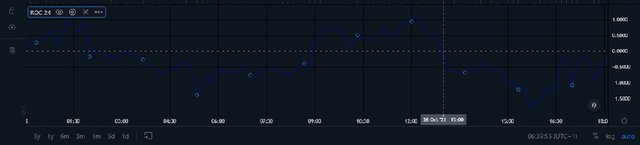
The ROC is a limitless momentum indicator that is used in technical analysis put against zero level extremes.
When ROC rise above zero, it commonly confirms that it's an uptrend but if ROC fall below zero, it points out that it's a downtrend.
Whenever the price is combined, the ROC will float near zero. In cases like that, traders must watch the overall price trend since the ROC will give little view except for confirming the combination.
When zero line cross on the ROC it indicate that a new trend is forming.
When zero line cross from below, it points out that a bull trend is now on, although a cross from above means that a downtrend is now informed.
signals that detect a trend reversal.
In sometimes, the ROC zero line cross can deliver indefinite signals to confirm a change of trend. To confirm trend reversals, traders can use ROC with two moving averages. For instance, when the ROC just crossed the zero line from above to give a downtrend signal, more confirmation will be given when the faster moving average crosses the slower one downwards.
4. What is the indicator’s role in determining buy and sell decisions and identifying signals of overbought and oversold؟(screenshot required)
If the ROC turns around its 0 lines, it means that there is no trend.
The stronger the indicator progress, the more powerful the movement of the bullish.
In the other way round, the faster the ROC falls is the stronger the downward is going to be.
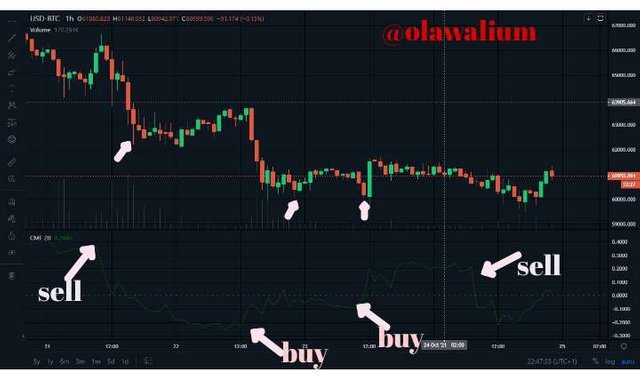
It's a buy signal when the ROC crosses straight 0 upwards but for the signal to be confirmed, the best thing to do is wait for the price to show signs of slowing down, for instance, if the indicator turns upwards as the price move on, it's a downtrend.
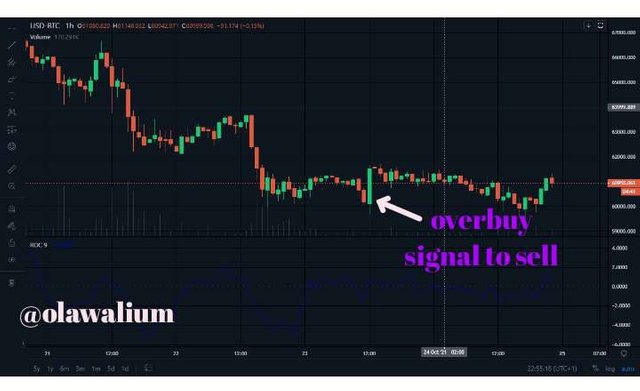
It's a sell signal when the ROC crosses straight 0 downwards. But, to confirm the signal, you should hold on until the price shows the signs of slowing down, for example when the indicator turns downwards as the price continues its uptrend
To determine overbought and oversold.
When ROC is above the zero-line and it's moving higher, it points out the trend is getting stronger. So, if it continues rising and it rises too far to +3 level, that could point out an overbought market. But If it is falling back towards the zero line, it points out slowing momentum and a possible change in trend.
In other words, when the prices fall, it will make an oversold signal and the market should then move up.
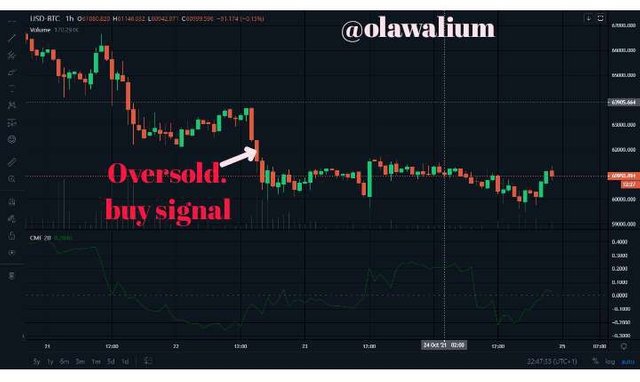
Whenever the ROC indicator surpass a spread of + or - 3 to 4%, a trader may explain it as an overbought or oversold sphere, so it's not recommended to take position.
If it is an overbought area, traders can use it to sell, the same thing goes with oversold areas, a trader should buy. It is because the main part of the downward movement is may perform.
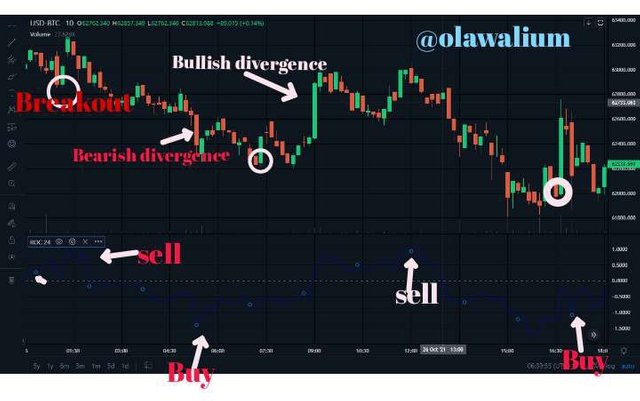
5. How to trade with divergence between the ROC and the price line? Does this trading strategy produce false signals? (screenshot required)
Divergences are great for market event significant change, and because ROC is a momentum indicator, it can come up with correct and compelling divergence signals.
Bullish divergence happens whenever the price started forming lower lows, but the ROC is forming higher lows. This act signal that the downtrend has lacked momentum and a trend change to the upside is about to happen.
Bearish divergence happens when the price is forming higher highs, but the ROC is forming lower highs. This is a sign that the uptrend lacks has momentum and a trend change to the downside is about to happen.
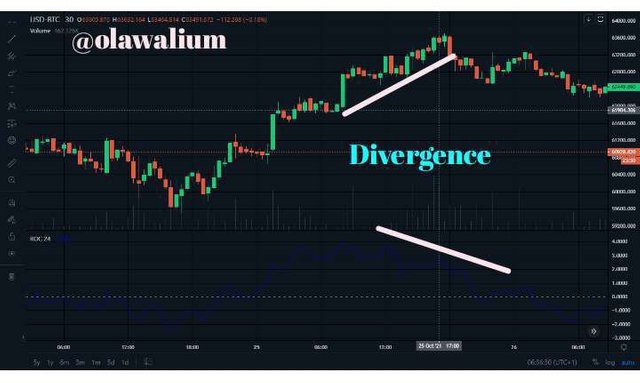
It is necessary to note that at times, a divergence signal may happen, try taking a little longer before playing out, and it is necessary to look for confirmation from other tools or even price candlesticks to know the best trade entry points.
6. How to Identify and Confirm Breakouts using ROC indicator? (screenshot required)
Breakouts happens whenever it's strong momentum, and the better indicator to qualify breakouts is the ROC. When the price is combined or moving, ROC will form flat values. So, a constant sharp rise or fall will assure that the breakout trend will be sustained while it's going forward.
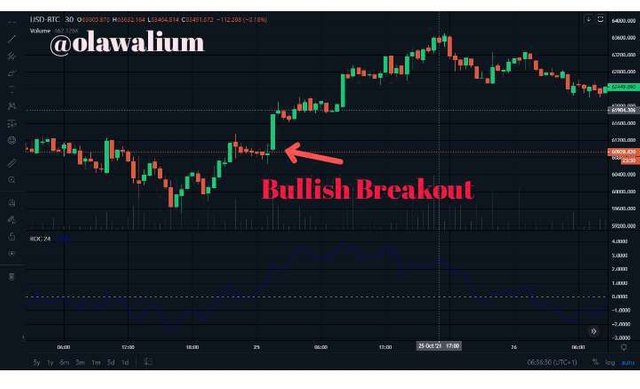
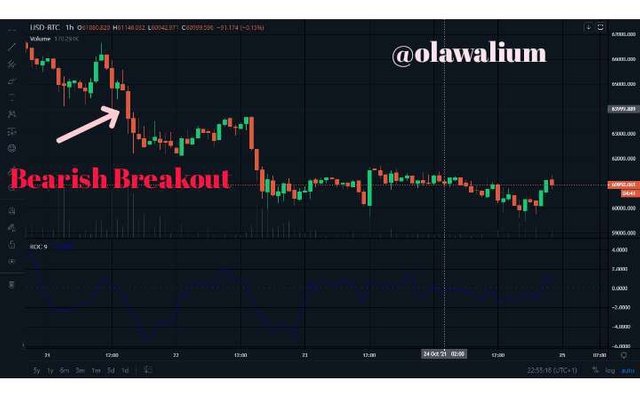
In other words, Breakouts always show due to strong momentum. But it can't be taken as a general rule because it's not of them are successful, so while using the ROC oscillator, it helps the trader to know the "True" breakouts.
7. Review the chart of any crypto pair and present the various signals giving by ROC trading strategy. (Screenshot required)*
Conclusion.
ROC is easy to understand, even for a novice trader or beginner, ROC is just only one line that's under the chart which simply points out where the trend is either bullish or bearish, but what it turn around it's 0, it means there's no trend.
It's a buy signal when the ROC crosses straight 0 upwards same thing applies when It's a buy signal, the ROC crosses straight 0.
In overbuy and oversold; when it overbuy, it's advice to sell when it's overbought and buy and it's oversold or just hold on until it goes back to normal.
Divergence is a market significant change, and because ROC is a momentum indicator, it can come up with correct and compelling divergence signals. But it's necessary to look for confirmation from other tools or even price candlesticks to know the best trade entry points.
Strong momentum causes a breakout, so, constant sharp rise or fall will assure that the breakout trend will be sustained while it's going forward.
Thank you for your time.
My pen doesn't bleed, it speaks, with speed and ease.
Still me,
My tongue is like the pen of a ready writer.
Olawalium; (Love's chemical content, in human form). Take a dose today: doctor's order.
Unfortunately @olawalium, your article contains plagiarized/Spun content
Total|0/10
Sources:
https://www.avatrade.com/education/technical-analysis-indicators-strategies/roc-indicator-strategies
https://www.tradingfuel.com/rate-of-change-roc-indicator/
https://school.stockcharts.com/doku.php?id=technical_indicators:rate_of_change_roc_and_momentum
The Steemit Crypto Academy community does not allow these practices. On the contrary, our goal is to encourage you to publish writing based on your own experience (or as per the mission requirements). Any spam/plagiarism/spun action reduces PoB's idea of rewarding good content.
Thank you.
Cc: -@endingplagiarism @sapwood
I am confused... Did you even check the links I dropped as my references? If you checked then you'd see I already inserted these links as references.
Cc: @steemcurator1
@steemcurator2
@steemitblog