Steemit Crypto Academy | Season 3 - Week 7 | Tradingview features | Homework Post for Professor @yousafharoonkhan

Defining the TradingView site and how to register an account in tradingview? what are the different registration plans? (screenshot necessary)
Tradingview is a platform that provides trading charts for traders, investors, educators, and market enthusiasts of all kinds whether cryptocurrency, forex, stock, and other market. Tradingview platform connects traders and investors for them to share ideas and talk about the market. It provides opportunities to boost one knowledge of the cryptocurrency markets and techniques. Tradingview provides useful technical indicators to help traders predict the market trend.
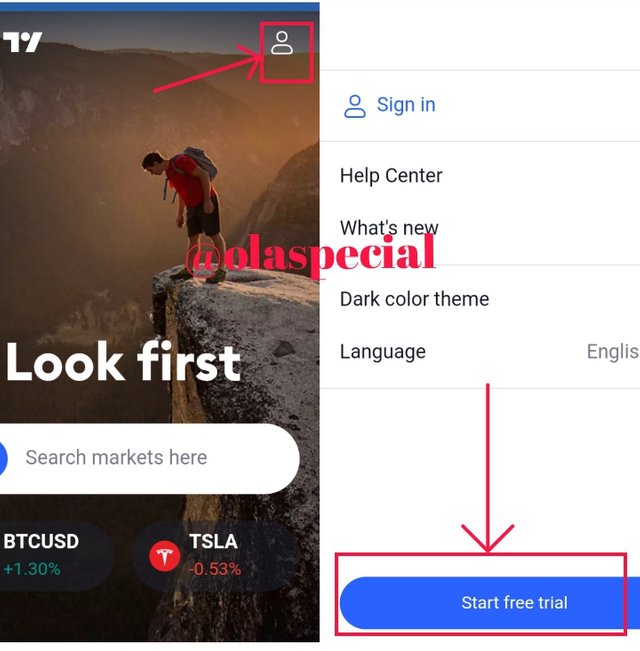
- First, visit Tradingview](https://www.tradingview.com) official website. Click on the little image at the right top corner. It will take you to another interface. Click on start free trial.
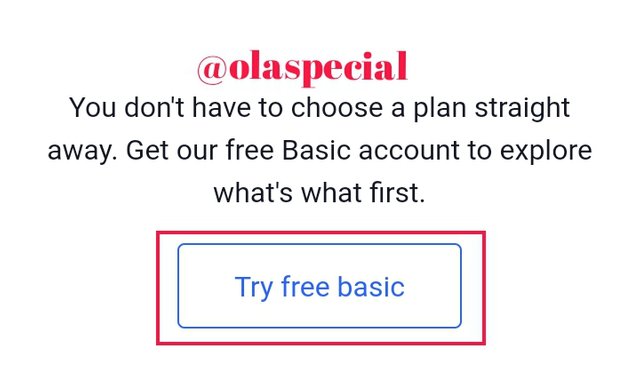
- Click on try free basic
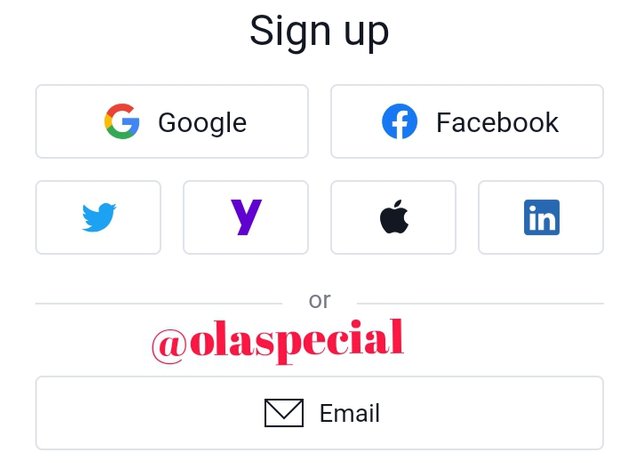
- You can select different methods of registration. Facebook, Google, Twitter, or Gmail.
- Enter your username, email address, and password, accept terms and conditions, confirm you are not a robot and then click click create an account.
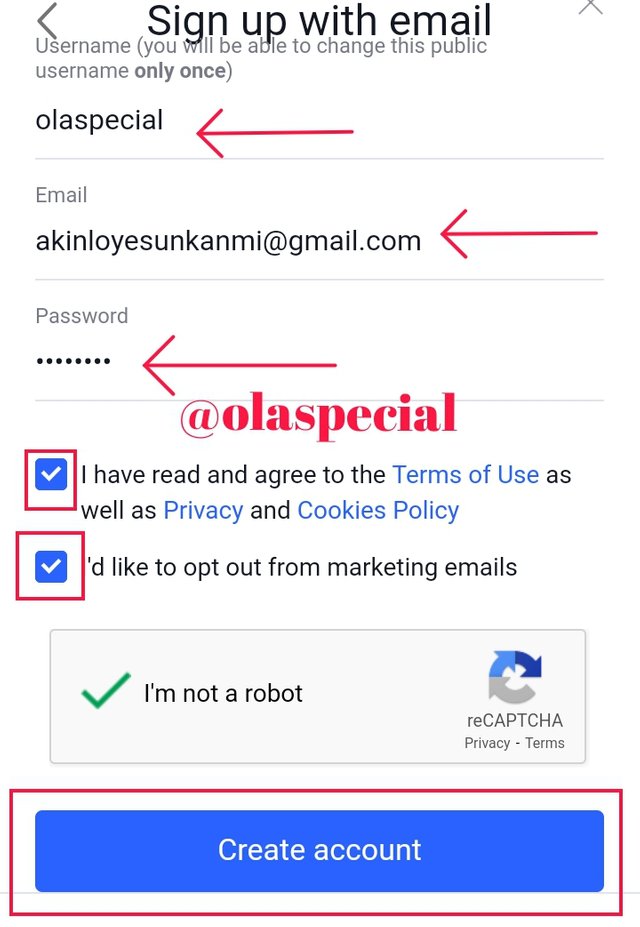
You will have to go to your Gmail account to verify your account.
After that, your account will be created successfully

Free plan give traders an opportunity to use the trading chart to predict trends but it lacks some advanced tools and products.

Pro plan price $14.95. Pro plan provides some features that are not available in free plans such as ad-free, 2 indicators per chart, 5 indicators per chart, 20 server-side alerts, custom time intervals, multiple enhanced watchlists, volume profile indicators, and bar replay on intraday bars
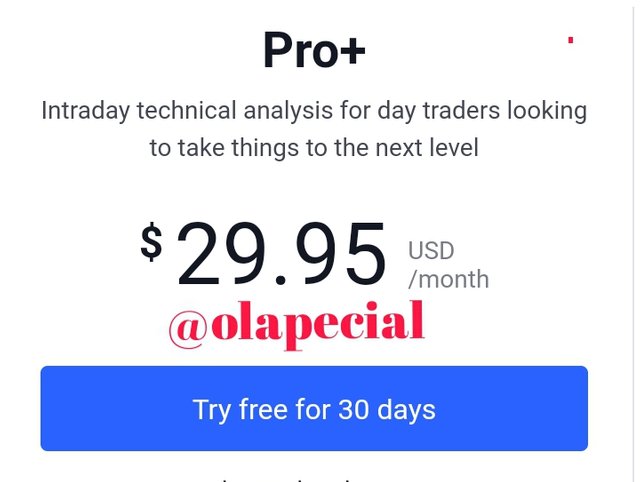
The pro+ price is $29.95. Pro+ plan next level of exciting features that are not available in Pro plans such as 10 indicators per chart, 100 server-side alerts, 4 charts in one layout, 2 devices at the same time, charts based on custom formulas, chart data export, Intraday exotic chart, and indicators on indicators

The premium price is $59.95. It has all tools and opportunities required to use the platform effectively. It has feature than Pro+ plan. It some additional features such as 8 charts in one layout, 25 indicators per chart, 400 server-side alerts 5 devices at the same time, alerts that don't expire, second based intervals, publishing invite-only indicators, and 4× more data on charts ( 20k bars )

Explain the different features of tradingView and what is your favorite feature and why? (screenshot necessary)
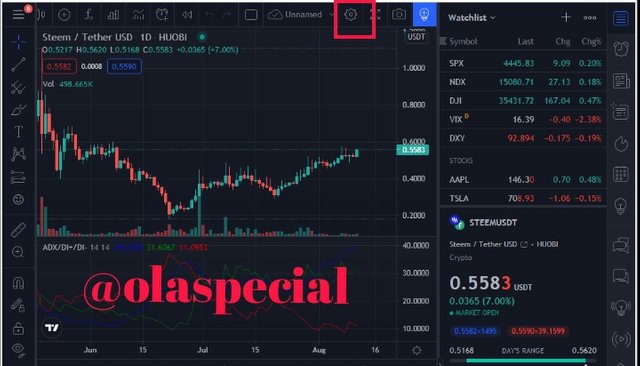
The chart provides information that can help the trader to identify the entry and exit of a position. The trading charts can be used in different patterns such as bar charts, line charts, point and figure, market profiles, and candlesticks. The chart helps the trader to identify the trend and displays the current state of the market.
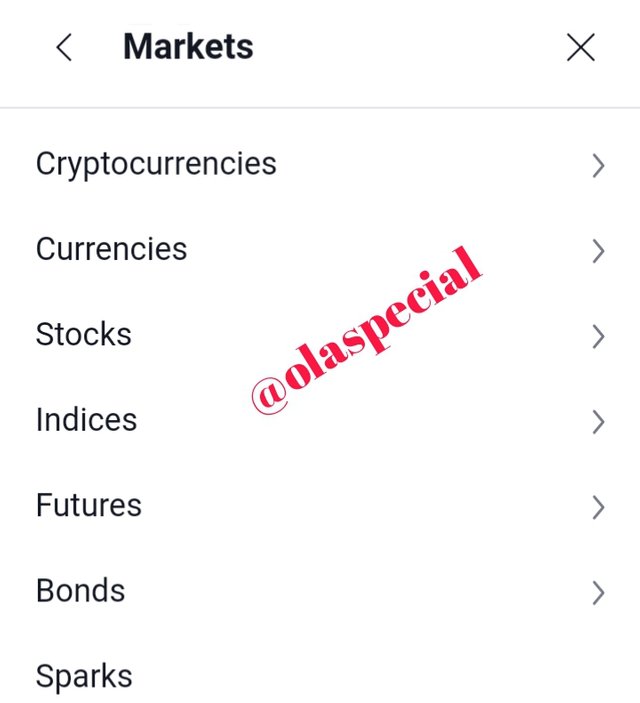
The market interface shows the list of cryptocurrencies, currencies, stocks, indices, futures, and bonds. It helps traders to easily identify the market they want to trade.
Cryptocurrency
It shows the list of cryptocurrencies and their price.
Stock
It shows the large-cap, top gainer, top losers, most active, most volatile, overbought, oversold, all-time high, all-time low, high dividend, sector and industry.
Indices
It has major world indices, us indices, S&P sector, and currency indices.
Futures
It has agricultural, energy, currencies, metals, world indices, and interest.
Bond
It has major 10Y, Americas, Europe, Asia, Middle East, Pacific, and Africa.
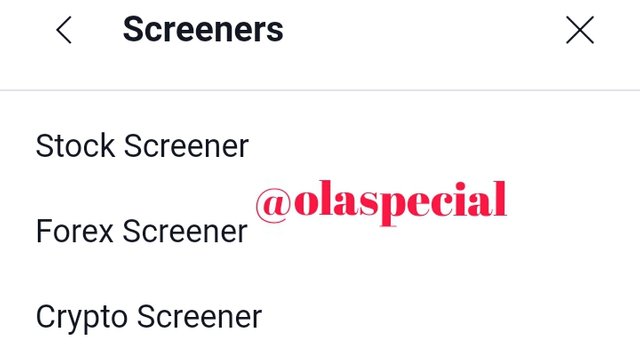
Under screeners, it has three available filters which are stock screeners, forex screeners, cryptocurrency. These are features that help traders get results with their indicators.
It provides analyses of cryptocurrencies and other assets. It also provides analyses of some useful technical indicators. It provides an opportunity to refer a friend.
My favorite feature is the chart interface because it helps me know the current trend and also provides useful indicators to predict the market. The color, length, and visibility can be changed to my self favorite pattern.

How to set up a chart in TradingView and use two tools to edit it. (screenshot necessary)
To edit a chart you need to TradingView plaform. We are in our tradingview chart of steem/ustd pair. Firstly, you need to click on settings at the top of the chart.

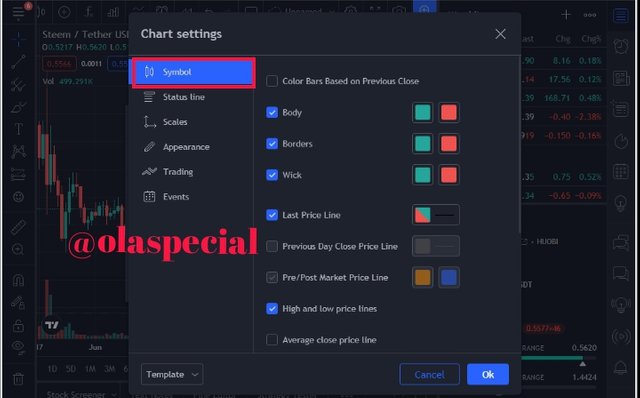
You can change the color body, wick, and borderline. You manipulate in it your liking.
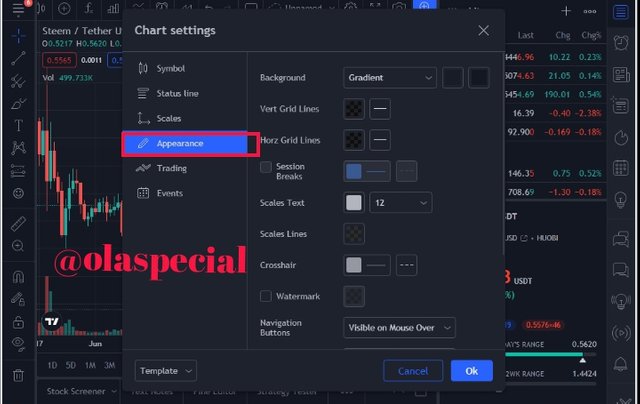
You also change the appearance. You change the background to white.
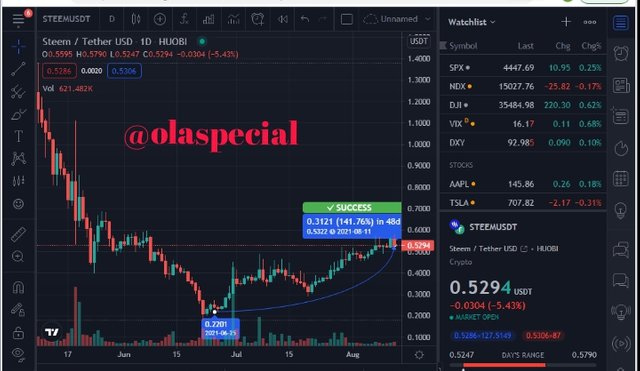
The first tool we will be using is the tool that can be use to predict the success and failure of the market.
Firstly, click on the icon represented with candle shape. Then, click forecast.
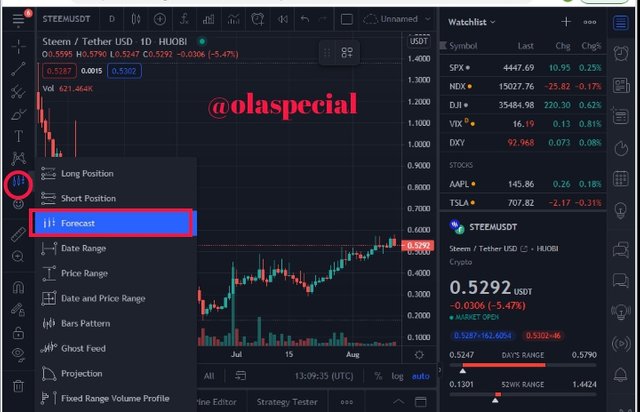
As you can see on the chart below that we have selecting point. Our selected starting point is 25-06-2021 and the price was 0.2201. Out end point is 11-08-2021 and the price is 0.5322. So, we have a difference of 0.3121 (141.76%) in 48 days which is a success.
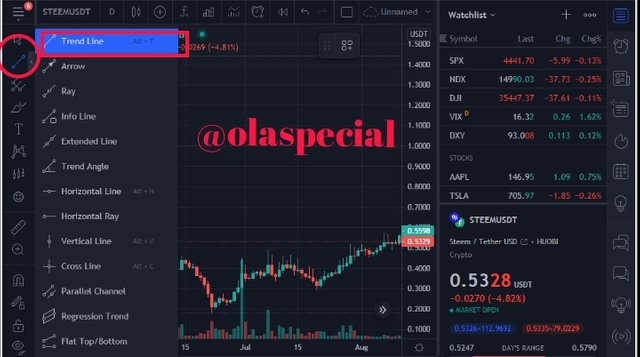
The second tool that we will be using is the trend line. We will apply the trend line tool to our STEEM/USDT pair chart. Firstly, click on the icon represented with line shape. Then, click on trend line.
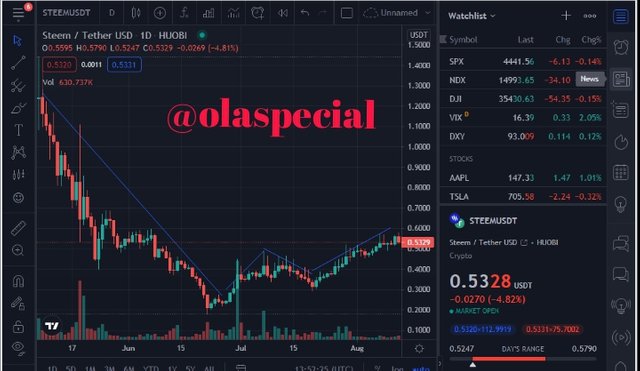
Our trend line has been drawn on our STEEM/USTD pair chart.
Explain how to add indicator in chart, what is your your favorite indicator and why? (screenshot necessary)
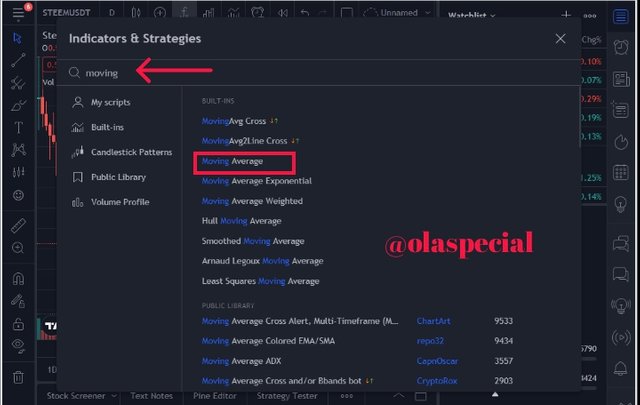
My favorite indicator is Moving Average (MA). It will show how to add MA on your chart. First launch your chart. Then, click on the icon at the top on of the chart.
<center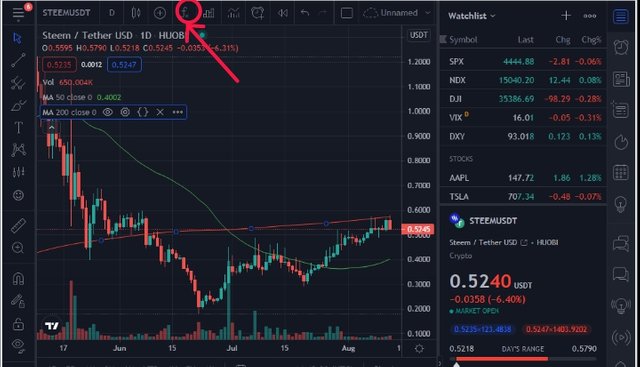
Enter moving average in the search bar
Now our indicator has been applied successful.
Why it is my favorite
This indicator is very reliable because it helps to identify trends and confirm reversals. The indicator also helps to identify area of support and resistance. It show clearly when the trend is up, down or ranging.
Do you think TradingView is useful in predicting the market for cryptocurrency (trend / price)?
Tradingview is a useful platform because it provides users with price data for assets, fundamental data, charts, technical analysis indicators, statistics, and other tools to help traders trade effectively. There special features that could help traders apply two or more trading software is also very useful. It gives the ability to practice on a demo account before trading with real money, this helps naive traders to riskless. Traders can test their skill before launching into the real world of trading.
Trading view platform technical aspect is very because it has interactive charting capabilities, including both chart patterns like trendline, forecast and shapes not excluding the technical indicators live vortex, moving average or momentum oscillators.
It also provides fundamental analysis and financial statements and practice tools develop specially for traders to make it easy to trade.
Traderview is platform that help traders around to trade effectively. There demo account has been useful aspect for naive traders to practice before launching into the real trader, this have been trader to practice the skills and reduce the potentials of loosing money.
It a must to register to be able to have access to their amazing tools and also the aspect of interaction with other traders around the world to share ideas that develop individuals skills.
Thank you professor @yousafharoonkhan for the wonderful lecture.
Respected first thank you very much for taking interest in SteemitCryptoAcademy
Season 3 | intermediate course class week 7
in below you chart you did not explain about indicator that how , you are going to add indicator, and above chart MA average is different than that explained in chart

it is not complete , you did not complete process
thank you very much for taking interest in this class