Steemit Crypto Academy | Season 3-Week 7 | Trading Crypto With Average Directional Index (ADX) Indicator

Discuss your understanding of the ADX indicator and how it is calculated? Give an example of a calculation. (Screenshot required)
The ADX is basically used as an indicator of movement, or to determine trend strength. It represents the average price ranges that are expanding and contracting over time. It show you line moving up and down whether or not there is strength movement. It does
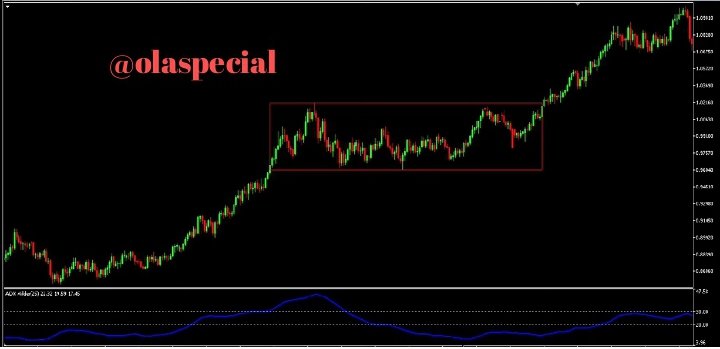
We have a chart above showing price that is moving upward in a very strong trend before it got stocked in a range that is highlighted by a red box on the chart. And then brakes out of the rage and recommended it upward trend. We have the ADX indicator in the trending by moving upward and it response to the range by moving lower. When it get back to the trend again, we could see the ADX moving again on the chart. The ADX does not look at the direction of the price moving, it just looks at whether or not the price is moving strongly in one direction. In other words, if there is an upward trend or downward trend, in that if the price stock in a range then the ADX will move lower.
As the name suggests, this is actually a system combination of the three indicator. First, it determines it the market is trending then provides an up or down signal.
ADX
3 line are typically down shown
+DI: Positive direction indicator
-DI: Negative direction indicator
ADX: Determines strength of trend.
First, we are going to consider whether or not it moved up or down.
MoveUp= Today's high (h) - Yesterday's High (yh) move down= Yesterday's low (yl) - Today's low (L)
If move up is greater than zero and move down. Positive Direction Move (POM) = MoveUp, else PDM = Zero
Otherwise, if MoveDown is greater than zero and MoveUp : New Direction Move (NDM) = Movedown, else NDM= Zero
Assuming a length of 30 days but you can use whatever length we want.
Positive Direction Index (PDI or DI): 100×(30EMA(PDM)/ATR)
Negative Direction Index (NDI or DI): 100×(30(EMA(NDM)/ATR)
ADX= 100×(30(EMA(PD1-ND1)/(PDI+NDI) or
ADX= 100×30EMA(abs(PDI-NDI) ÷ PDI + NDAI

Question 2
How to add ADX, DI+ and DI- indicators to the chart, what are its best settings? And why? (Screenshot required)
- First launch your trader chat and then click on indicator the top of the chart.

- Enter Average Directional Index with D+ and DI- in the search bar and click on it.

- Now we have ADI indicator on our chart

It's best is 30 because it tends to be more reliable able than the lower settings. Lower settings gives a lot of wrong signals.
Question 3
Do you need to add DI+ and DI- indicators to be able to trade with ADX? How can we take advantage of this indicator? (Screenshot required)
It is not compulsory we add DI+ and DI- indicators to be able to trade with ADX. ADX strong signal is also reliable.

The higher the trend, the better for the trader. It does matter the direction the market is moving, they could be a divergence in the ADX line and that gives the trader a confirmation of a possible reverse of the current trend. The point where the divergence occur is telling us price is expanding over the last 30 candles depending on settings the trader used.
Question 4
What are the different trends detected using the ADX? And how do you filter out the false signals? (Screenshot required)
It is important to understand what you are looking at. The green line which is the DI+ is showing the strength of the buyers and the red line which is the DI- is showing the strength of the seller. The blue line its simply the difference between red and green. The blue line does care whether red is on top and strong or green is on top and strong. As long as there is growing separation between green and red line, the blue line is going to go up.
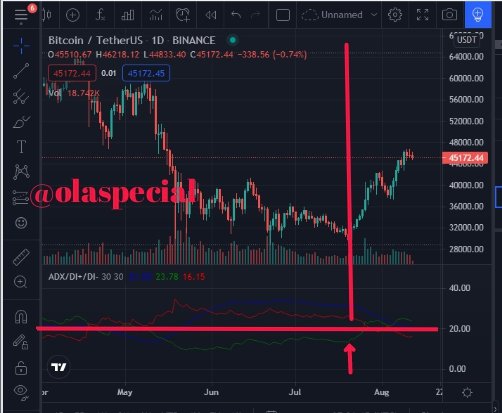
Uptrend
If we notice on the above chart that +DI line raise above -Di line, it is showing that the trend has started. ADX does not care what direction the market is going. If the market is going up in a long fashion, it has a lot power to the ADX will go up.

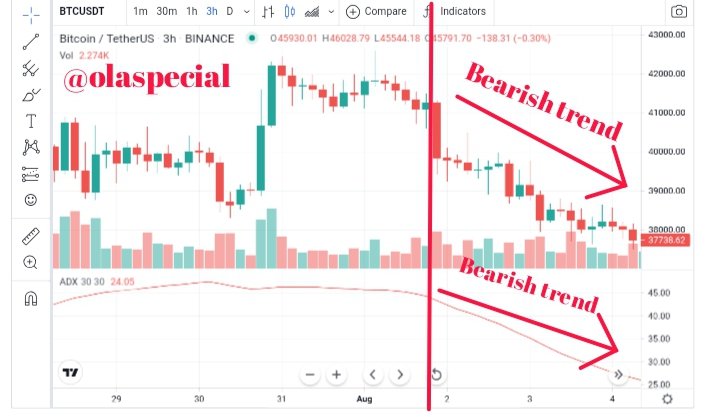
Downtrend
During the period of downtrend the -DI that is showing strength of the sell raise above that line on the chart below, it sell simply identifying that the there will be a strong downtrend. When red is on top and green is down the line drawn it mean sellers are in control. If ADX is going down in long way, the ADX will go down.

False Signal
The ADX is moving on a wrong direction.
Question 5
Explain what a breakout is. And How do you use the ADX filter to determine a valid breakout? (Screenshot required)
Break out is a trading methodology used to buy when the market moves in the trader's intended direction. It could be a break of a swing high, resistance, range, etc. So, if the price moving in a certain amount in your favor or direction that is where you enter the market. It is a period where the price of a particular cryptocurrency struggles to move above or below the support and resistance level but eventually moves beyond the support and resistance level.

Question 6
What is the difference between using the ADX indicator for scalping and for swing trading? What do you prefer between them? And why?
Scalping
Scalping is a method of trading where a trader takes advantage of the market by taking small profits continuously. It is the active entry and exiting positions several times in one day while trading to make a profit during high-velocity moves. A scalper will act quickly on relieves of cryptocurrency. Scalping and day trading are different things. Day traders will open trade once or twice with one day.
Swing
Swing trading is the type of trading that attempts to capture short to medium-term profit in the cryptocurrency market. It is usually from a period of a few days to weeks.
Difference between using the ADX indicator for scalping and for swing trading?
When you are using ADX indicator for scalping trader the line move faster which makes it difficult to use the signal while ADX indicator for swing traders is very reliable because there are usually enough times to study the chart and follow the signal.
Which do you prefer between them? And why
It prefers swing trading because it provides a reliable trade signal. It gives the trader enough to study the chart to know the right moment of entry and exit.
ADX technical indicator is a trading technique for traders and has been used by many traders around for years to get positive results. It is good to know have basic experience trading to be able to use ADX indicator due to some divergence in the line. Naive traders might understand the techniques, that is why it's good to study the history chart of the market in other to use the strategy effectively.
Hello @olaspecial,
Thank you for participating in the 7th Week Crypto Course in its third season and for your efforts to complete the suggested tasks, you deserve a 2/10 rating, according to the following scale:
My review :
An article with poor content due to the absence of analysis for several aspects of the topic, and here are the details.
This is the shortest answer I've read. There is no analysis of the idea, only vague information without interpretation.
Your remaining answers were superficial without delving into the analysis of the information used. You have to work more to reach a good level in writing and analysis. I advise you to read some good works.
Thanks again for your effort, and we look forward to reading your next work.
Sincerely,@kouba01